Organizing the World‘s Learning Content: How Coursera Uses Data Science to Power Content Discovery at Massive Scale
Introduction
Since its founding in 2012, Coursera has emerged as a global leader in online learning, offering over 5,000 courses and more than 25 degrees and professional certificates to 97 million registered users across 190 countries (Coursera, 2022). With content spanning an immense range of domains from the humanities to the hard sciences, the Coursera platform aims to provide universal access to high-quality learning content, tailored to each individual‘s interests and aspirations.
Realizing this ambitious vision, however, is no simple feat. One of the biggest challenges is figuring out how to effectively organize and surface relevant content for learners from such a massive and diverse content catalog. After all, even the most engaging and transformational course is only valuable if learners can actually discover it.
In this post, we‘ll take a deep dive into how Coursera has tackled this challenge over the years through a data-driven approach to content categorization. We‘ll explore how cutting-edge techniques from data science and machine learning have enabled the development of a scalable and dynamic taxonomy to power personalized content discovery for millions of learners worldwide.
The Challenge of Categorizing Learning Content at Scale
In Coursera‘s early days, the platform relied on a basic manual categorization scheme, not unlike what you might find in a traditional university course catalog. Courses were grouped into a couple dozen high-level categories like "Business & Management", "Medicine", and "Arts & Humanities" based largely on intuition and convention (Stein, 2019).
While serviceable initially, the limitations of this approach quickly became apparent as Coursera‘s catalog grew exponentially in both size and scope. By 2015, the platform already offered over 1,000 courses on an expansive range of topics from Scandinavian film to spacecraft dynamics (Krasner, 2015). Trying to neatly fit this eclectic mix of content into a few dozen bins was like trying to organize books in a vast library using only the Dewey Decimal System‘s top-level categories.
The result was that topically similar courses often ended up siloed in different categories while courses with little in common got lumped together. For example, the original "Medicine" category encompassed everything from introductory biology courses to niche offerings on biostatistics and emergency field medicine.

Coursera topic model visualization from 2015 showing over 1000 course topics (Wang & Perozzi, 2015)
As Eli Stein, a Data Scientist at Coursera, put it: "The original categorization scheme was not meeting our need of effectively matching learner to content" (Stein, 2019). It was clear that a more sophisticated, data-driven approach was needed – one that could scale elegantly with Coursera‘s ever-growing and diversifying catalog while surfacing valuable interdisciplinary connections.
Uncovering Hidden Structure in Course Data with t-SNE
To develop a more meaningful content categorization, Coursera‘s data science team turned to an unsupervised machine learning technique called t-distributed stochastic neighbor embedding, or t-SNE.
Originally developed by Geoffrey Hinton and Laurens van der Maaten, t-SNE is a dimensionality reduction algorithm that specializes in visualizing and clustering high-dimensional data (Maaten & Hinton, 2008). It works by mapping data points from a high-dimensional space to a lower-dimensional space (usually 2D or 3D) such that similar points end up close together and dissimilar points far apart.

Illustration of how t-SNE maps high-dimensional data to a low-dimensional space (Olah, 2014)
When it comes to categorizing courses, the key insight is that patterns of learner enrollment can serve as a kind of "signature" capturing topical similarity. The thinking goes: if a disproportionate number of learners tend to take two courses together, those courses are more likely to be related in some meaningful way.
To operationalize this idea, the data science team represented each course as a high-dimensional vector encoding its enrollment correlations with every other course. They then fed these vectors into t-SNE to map them to a 2D space (Stein, 2019).
The resulting visualization was revelatory:

t-SNE visualization of Coursera courses based on learner enrollment patterns, circa 2015 (Stein, 2019)
Courses clustered together in striking alignment with their subject matter. Remarkably, the algorithm had reconstructed what looked like a map of human knowledge using enrollment data alone, without relying on any course content.
Some notable insights that jumped out:
- A clear partition between STEM courses on the left and humanities/social science courses on the right
- Granular clustering within each domain, like distinct clusters for math, computing, physical sciences and biomedical sciences within STEM
- Courses at disciplinary boundaries clustered between their "parent" domains (e.g. quantitative social science between math and social science)

Major domain clusters in Coursera‘s 2015 t-SNE course visualization (Stein, 2019)
The data science team was able to formalize these visual clusters into a multi-level taxonomy through semi-automated clustering techniques like DBSCAN and manual curation (Stein, 2019). The result was a new two-tiered categorization system of high-level "domains" and more granular "subdomains":

Example of Coursera‘s domain/subdomain taxonomy from 2019 (Stein, 2019)
This data-driven taxonomy powered substantial improvements to content discovery on the Coursera platform. With rich new metadata on the latent topic structure of the catalog, Coursera could serve learners much more relevant recommendations and create dynamic interfaces for exploring the rich connections between courses and subject areas.
The Global Dimension
Having re-architected content categorization for its core use case of serving learners, Coursera next turned attention to an important emerging challenge: extending the taxonomy to a more global context.
By 2017, over half of Coursera‘s learners were from outside the United States, with particularly rapid growth in India, China and Latin America (Coursera, 2017). Many of these international learners were engaging with courses taught in their local languages. This presented a new challenge for content categorization, since language itself was now a key driver of enrollment patterns independent of topic.
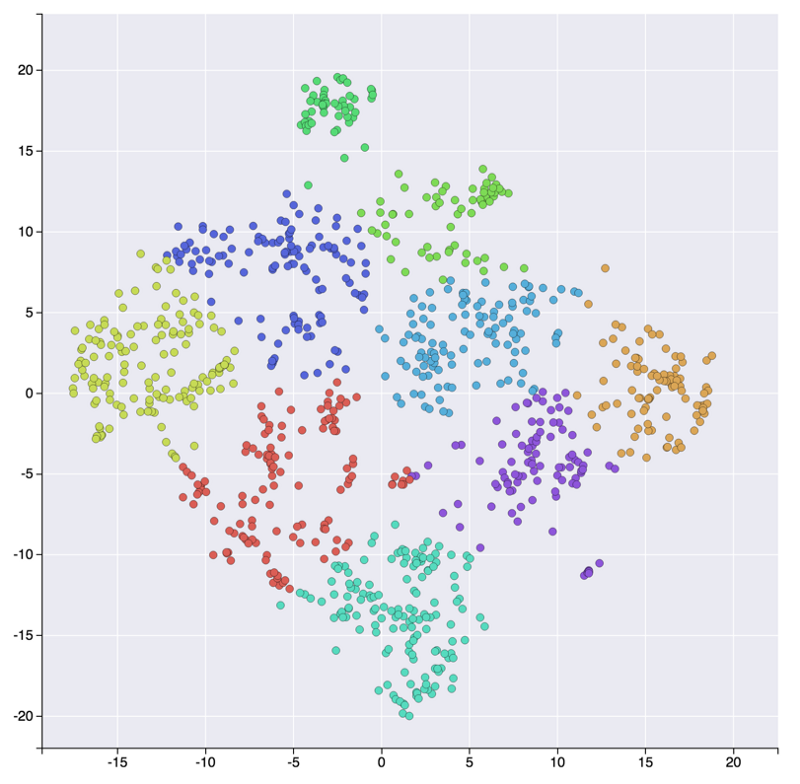
Applying t-SNE to course enrollment data from different language groups revealed that the algorithm did not generalize well across languages. For example, here‘s what the t-SNE plot looked like for Chinese language courses:

Coursera t-SNE visualization of Chinese language courses (Zhao, 2018)
Rather than capturing meaningful curriculum structure, the visualization shows courses clustered more by university than topic, suggesting that a more language-aware approach is needed.
To address this, Coursera has experimented with using multilingual text embeddings to capture semantic similarity between courses in different languages based on their textual content (Wang & Perozzi, 2015). The data science team has also explored clustering courses within each language independently and mapping clusters across languages (Zhao, 2018).
While finding globally scalable solutions remains an active area of research and development, these efforts demonstrate the importance of a nuanced, culturally-responsive approach to content categorization in an increasingly borderless online learning landscape.
New Frontiers in Scalable Content Organization
Seven years after its initial foray into data-driven content categorization, Coursera now offers over 5,000 courses and credentials to over 100 million learners worldwide (Coursera, 2022). The platform‘s content discovery efforts have matured into a dynamic ecosystem powered by scalable machine learning infrastructure and ever-richer data.
Recent efforts have focused on expanding coverage to Coursera‘s growing portfolio of non-course learning experiences including hands-on projects, labs, and guided tutorials. Capturing pedagogical and experiential similarity across these diverse content types is an exciting frontier.

The growth of Coursera‘s content catalog across types from 2017 to 2022 (Coursera, 2022)
Advances in natural language processing are also enabling powerful new techniques for incorporating unstructured textual data into content categorization. Coursera is now using large language models and deep learning to capture more nuanced topical semantics from sources like course descriptions, transcripts and forum discussions (Hamilton, 2022).
The overarching vision is an ever-more personalized and adaptive learning platform that can fluidly match learners with the most relevant content for their needs from an expansive universe of offerings. Getting content categorization right is the foundational first step in realizing this vision.
Conclusion
Coursera‘s evolving approach to data-driven content organization offers a compelling case study in the power of AI to transform online education. What started as a single visualization has matured into a sophisticated discovery ecosystem combining machine learning, information retrieval, and thoughtful product design to help millions of learners chart customized learning journeys.
More fundamentally, this work embodies the profoundly humanistic possibilities of AI in education. By surfacing the latent structure in humanity‘s learning activities, we can build smarter systems to support and empower learners at unprecedented scale. We can make the expanding universe of learning content more accessible and navigable for everyone.
Organizing the world‘s learning content is no small undertaking – but with data and intelligent systems on our side, it‘s an eminently achievable goal. The story of content categorization at Coursera offers an inspiring glimpse of what‘s possible when we marry the power of data science with the promise of universal learning. As the poet T.S. Eliot once wrote: "We shall not cease from exploration, and the end of all our exploring will be to arrive where we started and know the place for the first time."
References
- Coursera. (2022). About Coursera. https://about.coursera.org/
- Hamilton, S. S. (2022). Deep Learning for Content Understanding. Talk at Coursera Data Day. https://coursera.engineering/data-day-2022/
- Krasner, D. (2015). Across a Wide Range of Categories, the Number of Courses on Coursera Grew by 88% in 2014. Class Central. https://www.classcentral.com/report/number-of-courses-on-coursera-grew-by-88-in-2014/
- Maaten, L. V. D., & Hinton, G. (2008). Visualizing Data using t-SNE. Journal of Machine Learning Research, 9, 2579–2605. https://jmlr.org/papers/v9/vandermaaten08a.html
- Olah, C. (2014). Visualizing MNIST: An Exploration of Dimensionality Reduction. https://colah.github.io/posts/2014-10-Visualizing-MNIST/
- Stein, E. (2019). Categorizing the World of Education with Data Science. Talk at Strata Data Conference, New York. https://conferences.oreilly.com/strata/strata-ny-2019/users.html#user-30431
- Wang, E., & Perozzi, B. (2015). Using multi-lingual search data to build a global semantic labeling system. https://coursera.engineering/using-multi-lingual-search-data-to-build-a-global-semantic-labeling-system-80a1e5cea7af
- Zhao, K. (2018). Learning Market Patterns in China: A Case Study on Coursera. https://medium.com/@karlzhaork/learning-market-patterns-in-china-a-case-study-on-coursera-8356ad23d754