
Sketching Data: How Drawdata Enables Fast and Flexible Dataset Creation
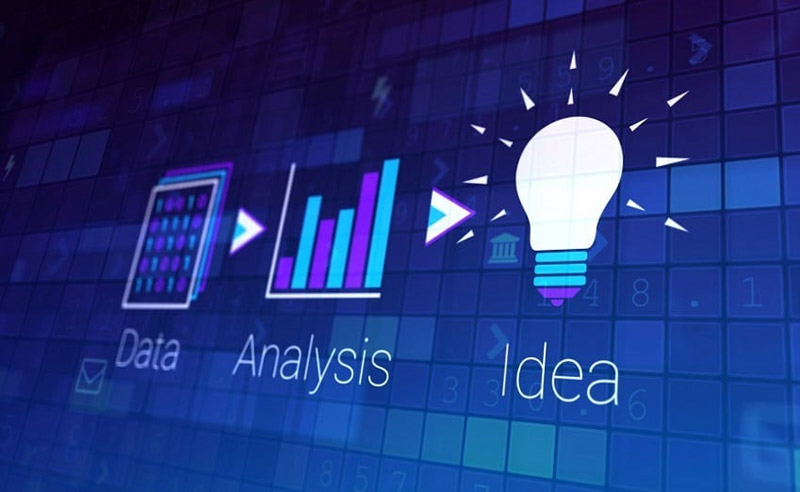
Data is the fuel that powers modern machine learning and artificial intelligence. As the famous sayings go, "data is the new oil" and "garbage in, garbage out"—the quantity and quality of data directly determines the performance of ML models. However, obtaining suitable datasets remains a major bottleneck in the data science workflow.
According to a 2020 survey by Anaconda, data scientists spend nearly 45% of their time on data preparation tasks like loading, cleaning, and transforming datasets. This highlights the need for better tools to streamline the process of creating ML-ready data.
Synthetic data generation has emerged as a promising approach to augment or replace real-world datasets. By programmatically creating data that mimics real-world distributions, we can generate custom datasets tailored to specific problems and domains.
One novel library for synthetic data generation is Drawdata, which allows users to literally sketch the datasets they want. With an intuitive interface and grounding in mathematical principles, Drawdata enables rapid prototyping of datasets and lowers the barrier to entry for data science.
The Power and Peril of Data in Machine Learning
It‘s hard to overstate the importance of data in modern machine learning. Gone are the days of hand-engineering features and decision rules—today‘s state-of-the-art ML models are trained end-to-end on massive datasets. The paradigm of "software 2.0" posits that code is increasingly replaced by data as the primary way we teach machines to perform complex tasks.
However, the reliance on data comes with its own challenges. As Garbage In, Garbage Out states, ML models are only as good as the data they‘re trained on. Biased, incomplete, or unrepresentative datasets can lead to flawed models that fail in the real world or perpetuate societal disparities.
For example, a 2019 study by the National Institute of Standards and Technology found that facial recognition systems had significantly higher error rates for women, people of color, and other demographic groups underrepresented in training datasets.
Creating high-quality datasets is a non-trivial endeavor. It requires navigating issues of data collection, cleaning, labeling, storage, privacy, fairness, and more. Many domains lack readily available datasets, and even when data is accessible, preparing it for ML consumption takes significant time and expertise.
This is where synthetic data generation comes in. By creating artificial datasets that capture the essential patterns and characteristics of real data, we can accelerate the ML workflow and test models under a wider range of scenarios.
Synthetic Data Generation Approaches
There are several existing approaches to generating synthetic data:
-
Probabilistic modeling: Specifying a generative model of the data, typically using a combination of domain knowledge and parametric distributions. Examples include Bayesian networks, hidden Markov models, and probabilistic grammars.
-
Simulation: Generating data from a computer simulation or physics engine that models the dynamics and interactions of a system. Commonly used in fields like robotics, autonomous driving, and computer graphics.
-
Neural networks: Training deep generative models to learn the underlying probability distribution of real data and generate new samples. Popular architectures include generative adversarial networks (GANs), variational autoencoders (VAEs), and normalizing flows.
-
Adversarial learning: Explicitly training models to generate data that fools a discriminator network, as in GANs. This encourages the generated data to match the statistics of real data.
-
Data augmentation: Applying transformations and perturbations to real data to create new samples. Common techniques include cropping, flipping, rotating, and adding noise.
While powerful, these approaches have limitations. Probabilistic models and simulation require significant domain expertise to specify the right generative process. Neural network-based methods can generate realistic data but are often difficult to train and interpret. Data augmentation is limited to the scope of transformations applied.
Drawdata takes a different approach by putting humans in the loop. By leveraging our rich visual understanding and domain knowledge, Drawdata allows us to quickly sketch datasets representing the patterns we care about. Let‘s dive into how it works.
Introducing Drawdata
At its core, Drawdata is a Python library that turns hand-drawn patterns into structured datasets. Users sketch the desired characteristics of their data using an interactive canvas, and Drawdata converts the drawings into a tabular format suitable for ML models.
The key insight is that while humans may not be able to manually specify complex probability distributions, we have a keen intuition for what patterns look like. We can recognize clusters, correlations, and anomalies with just a glance. Drawdata taps into this visual understanding to create datasets in a fast, flexible, and interpretable way.
Here‘s a simple example of using Drawdata to sketch a binary classification dataset:
from drawdata import draw_scatter

# Open the drawing interface
scatter_plot = draw_scatter()

# Draw two clusters of points representing two classes
# Use different colors for each class
# Export the drawn data to a DataFrame
df = pd.read_clipboard(sep=‘\\t‘)

print(df.head())
#   x   y  label
#0  51  82     0
#1  55  75     0
#2  20  30     1
#3  24  35     1
#4  60  70     0
With just a few lines of code and some freehand drawing, we‘ve created a labeled dataset ready for training a classifier. The user can draw points anywhere on the canvas, and Drawdata automatically scales and normalizes the coordinates into a consistent range.
Drawdata supports several common plot types used in data visualization and ML:
-
Scatter plots: For drawing 2D point clouds representing relationships between continuous variables. Useful for clustering, classification, and regression tasks.
-
Line plots: For drawing series data representing temporal patterns and trends. Applicable to time series forecasting, anomaly detection, and sequence modeling.
-
Histograms: For drawing the distribution of a single variable. Captures important statistical properties like central tendency, dispersion, and modality.
-
Bar charts: For drawing categorical data. Can represent relative frequencies, counts, or other aggregate metrics for discrete variables.
In addition to the core drawing functionality, Drawdata provides options for customizing the appearance of plots, such as the color, size, and opacity of the drawing brush. It also supports interactive editing, like adjusting individual data points or annotations.
By composing these plot types and options, users can create datasets for a wide range of ML tasks and domains. Drawdata‘s flexibility is one of its key strengths—the same tool can be used for quick back-of-the-envelope prototypes and principled dataset design.
Mathematical Foundations
Drawdata is not just a ad hoc tool, but is grounded in key principles from mathematics and data science. At a high level, Drawdata can be viewed as a framework for inverse data visualization—given a plot representing the desired patterns, generate the underlying dataset.
More formally, let $\mathcal{X}$ be the space of possible datasets and $\mathcal{Y}$ be the space of possible visualizations. Drawdata learns a mapping $f: \mathcal{Y} \rightarrow \mathcal{X}$ that takes in a hand-drawn plot $y \in \mathcal{Y}$ and outputs a dataset $x \in \mathcal{X}$ that would generate the plot.
For 2D scatter plots, the input space $\mathcal{Y}$ is the set of all possible point patterns in the plane, which can be represented as a sequence of coordinates $(x_i, y_i)$. The output space $\mathcal{X}$ is the set of all possible $n \times 2$ matrices representing 2D point clouds.
Drawdata uses a combination of interpolation, smoothing, and normalization to map messy hand-drawn patterns to clean and consistent numerical matrices. For example, it applies Gaussian kernel density estimation to convert discrete pen strokes to a continuous 2D probability distribution.
For line plots, the input is a sequence of vertices defining a polygonal chain, and the output is a regularly sampled time series. Drawdata applies spline interpolation and filtering to remove noise and extrapolate to a fixed length.
Histograms and bar charts are mathematically similar, with the main difference being whether the bins represent continuous intervals or discrete categories. In both cases, Drawdata normalizes the drawn heights to valid probability densities or frequency counts.
By building on these mathematical principles, Drawdata provides a robust and principled way to sketch datasets. The details of the input-to-output mappings are abstracted away from the user, but can be customized by advanced users through the library‘s API.
Advantages of Human-in-the-Loop Data Generation
Drawdata‘s human-centered approach to data generation has several advantages over purely automated methods:
-
Domain knowledge: Humans have rich prior knowledge about what dataset patterns are relevant for a given problem. By drawing data manually, we can directly inject this domain knowledge into the data generation process. In contrast, automated methods have to learn this knowledge indirectly from large datasets.
-
Speed and efficiency: Drawing a dataset takes just a few seconds, while training complex generative models can take hours or days. Drawdata enables rapid iteration and prototyping of datasets, which is especially useful in the early stages of a project.
-
Interpretability: Hand-drawn datasets are highly interpretable, as the user has full control and understanding of what patterns they encode. In contrast, the outputs of deep generative models can be difficult to explain or reason about.
-
Customization: Drawdata gives users fine-grained control over the characteristics of the generated data. Users can draw specific patterns, outliers, or edge cases that may be difficult to produce with automated methods.
-
Interactivity: Drawdata‘s interactive interface allows users to quickly visualize and adjust datasets on the fly. This tight feedback loop facilitates a more exploratory and intuitive data generation process.
To be clear, Drawdata is not a replacement for large-scale data collection or automated data generation. Rather, it is a complementary tool that allows humans to more easily express their knowledge and intent in the form of data. Drawdata is particularly well-suited for:
- Prototyping and testing ML models on small-scale datasets
- Generating datasets for rare or hard-to-collect phenomena
- Augmenting real datasets with specific drawn patterns
- Teaching and explaining ML concepts through interactive examples
- Quickly visualizing and debugging datasets during EDA
Use Case: Sketch-Based Classifier Evaluation
To make the usage of Drawdata more concrete, let‘s walk through a practical example of using hand-drawn data to evaluate a binary classifier. Suppose we‘re building a system to classify images of handwritten digits as either "0" or "1". We want to test how well our classifier can learn the concept of a digit from just a few examples.
First, we use Drawdata to sketch examples of the two digits:
from drawdata import draw_scatter

scatter_plot = draw_scatter(label=‘Digit‘)
We draw 50 examples of each digit, doing our best to capture the natural variations in handwriting. Each point is labeled as either "0" or "1".
After exporting the data to a DataFrame df, we can train a simple logistic regression classifier:
from sklearn.linear_model import LogisticRegression

X = df[[‘x‘, ‘y‘]]
y = df[‘label‘]

clf = LogisticRegression()
clf.fit(X, y)
To evaluate the classifier, we can draw new test examples and see how well it predicts the labels:
test_plot = draw_scatter(label=‘Digit‘)
test_df = pd.read_clipboard(sep=‘\\t‘)

X_test = test_df[[‘x‘, ‘y‘]]
y_test = test_df[‘label‘]

accuracy = clf.score(X_test, y_test)
print(f‘Test accuracy: {accuracy:.2f}‘)
By drawing test digits that are purposely challenging (e.g. sloppy or ambiguous), we can probe the limits of our classifier and diagnose areas for improvement. Drawdata allows us to quickly generate tailored evaluation datasets, beyond what standard benchmark datasets provide.
Of course, this is a toy example—in practice, we would use more sophisticated models and real image data. But the sketch-based workflow is similar: draw patterns to train an initial prototype, evaluate on test sketches, and iterate.
This example shows how Drawdata integrates into the broader ML development cycle. It‘s a versatile tool for data generation, but must be used thoughtfully in conjunction with sound engineering and evaluation practices.
Conclusion
Drawdata is a powerful and intuitive library for creating custom datasets through freehand drawing. By combining the flexibility of the humble sketch with the rigor of data science, Drawdata enables rapid prototyping, creative experimentation, and knowledge sharing.
In a world where data is increasingly seen as the key to AI progress, tools like Drawdata remind us that humans still have an important role to play. Our visual intuition and domain expertise can guide and accelerate the process of turning raw data into valuable insights.
Of course, Drawdata is not a panacea. It is limited to relatively low-dimensional datasets and relies on subjective human judgment. Sketched datasets should be seen as a starting point for further data collection and model iteration, not an end in themselves.
Nonetheless, Drawdata is a valuable addition to the data scientist‘s toolkit. It lowers the barrier to entry for ML experimentation and empowers domain experts to more easily translate their knowledge into data. As the field of data science continues to evolve, interactive and human-centered tools like Drawdata will play an increasingly important role.
So next time you‘re stuck on a data problem, try sketching out a solution! You may be surprised at how far a simple drawing can take you.


