Essentials of Deep Learning: Visualizing Convolutional Neural Networks
Introduction
Convolutional neural networks (CNNs) have become the dominant approach in computer vision, achieving state-of-the-art results on tasks like image classification, object detection, semantic segmentation, and face recognition. CNNs automatically learn hierarchical representations from raw pixel data, reaching superhuman performance in many visual domains.
However, this impressive performance comes at the cost of interpretability. The learned features are abstract, distributed across hundreds of convolutional filters, and highly sensitive to small input perturbations. With millions or even billions of parameters, the function learned by a CNN is a complex, nonlinear transformation that is challenging for humans to understand.
This opacity is problematic when CNNs are deployed in real-world applications that require trust, reliability, and accountability. If an autonomous vehicle misclassifies a pedestrian with fatal consequences, we need to understand what went wrong. If a medical CNN disagrees with an expert radiologist on a cancer diagnosis, a doctor needs insight into the model‘s decision before acting on it.
As AI systems become more prevalent in high-stakes domains, the deep learning community has recognized the critical importance of interpretability. In recent years, researchers have developed a variety of techniques to visualize the learned representations and decision-making processes of CNNs.
While we still have significant progress to make in explainable AI, current CNN visualization methods offer valuable tools for researchers and practitioners to debug models, identify potential biases and failure modes, and build safer and more reliable AI systems.
In this article, we‘ll dive into the key approaches to visualizing CNNs, including activation maximization, saliency maps, and feature attribution. We‘ll walk through code examples and discuss best practices for interpreting these visualizations. Finally, we‘ll examine the limitations of current techniques and the frontiers of interpretability research.
But first, let‘s briefly review the architecture and key components of CNNs to set the stage for understanding visualization techniques.
Convolutional Neural Network Architecture

A typical CNN architecture consists of three main types of layers stacked together:
-
Convolutional layers: These are the core building blocks of CNNs. A convolutional layer consists of a set of learnable filters that convolve across the input to produce feature maps. Each filter learns to detect a specific visual pattern. Early layers tend to learn simple textures and edges, while deeper layers respond to more complex and abstract features like object parts and faces. Convolutional layers are typically followed by nonlinear activation functions like ReLU.
-
Pooling layers: Pooling layers downsample the spatial dimensions of the feature maps, typically by computing the maximum or average value in local patches. This reduces computational cost and provides some invariance to small translations and distortions. The most common configuration is max pooling with 2×2 filters and stride 2.
-
Fully-connected layers: After a series of convolutional and pooling layers, the feature maps are flattened and passed through one or more fully-connected layers. These layers learn a nonlinear function to map the extracted visual features to class scores or other outputs depending on the task. The final layer typically uses a softmax activation to produce a probability distribution over the classes.
CNNs have several key advantages over traditional computer vision techniques:
- They learn feature hierarchies directly from data, alleviating the need for manual feature engineering
- They share weights across spatial locations, enabling efficient learning and inference on high-resolution images
- Their architectures are highly modular and scalable, allowing transfer learning and rapid iteration
Given their power and flexibility, it‘s not surprising that CNNs have come to dominate nearly every area of computer vision. However, their complexity also creates challenges for interpretability.
The Challenge of CNN Interpretability
There are a few key reasons why CNNs are so difficult to interpret:
-
Abstraction: The learned features become increasingly abstract as we move deeper in the network. While early layers may learn simple patterns like edges and textures, deeper layers encode highly nonlinear combinations of these low-level features. It‘s often not clear what visual concept a given filter is responding to.
-
Distribution: The representation of a visual concept is distributed across many filters and spatial locations. There‘s no one-to-one mapping between a feature and a single neuron. This makes it hard to point to a specific part of the network and say "this is the dog detector."
-
Sensitivity: CNNs can be highly sensitive to small perturbations in the input image. Adversarial examples have shown that imperceptible changes to an image can cause drastic changes in the output. This brittleness makes it difficult to trust and interpret CNN predictions.
-
Scale: Modern CNNs often have millions or even billions of learnable parameters. The sheer size of these models makes it challenging to reason about what each parameter does and how they interact.
Despite these challenges, the past few years have seen exciting progress in CNN visualization and interpretability. Let‘s dive into some of the key techniques.
Activation Maximization
One of the most popular approaches to visualizing CNNs is activation maximization. The idea is simple: we start with a random input image and optimize it to maximize the activation of a specific neuron or channel in the network. This generates a synthetic image that represents what the neuron has learned to detect.
Mathematically, let $h_{i,j}(x)$ be the activation of neuron $i$ in layer $j$ for input image $x$. We want to find an image $x^*$ that maximizes this activation:
$$x^* = \arg\maxx h{i,j}(x)$$
In practice, we also add regularization terms to the objective to encourage the generated image to look more natural and interpretable. Typical regularizers include total variation (TV) to promote spatial smoothness and L2 regularization to prevent extreme pixel values.
Here‘s an example of activation maximization applied to the "dog" class in the final layer of a CNN trained on ImageNet:

The optimized image clearly shows many dog-like features such as fur texture, snout, and ears. This suggests that the CNN has learned a meaningful representation of the dog category.
However, activation maximization also has some limitations. The optimized images often look unnatural and contain unrealistic artifacts. They may not capture the full diversity of inputs that activate a given neuron. And in some cases, the visualizations can be misleading, highlighting spurious correlations rather than true semantic concepts.
Nonetheless, activation maximization remains a powerful tool for probing the learned representations of CNNs. It‘s particularly useful for understanding the role of individual neurons and comparing representations across different architectures and training settings.
Saliency Maps
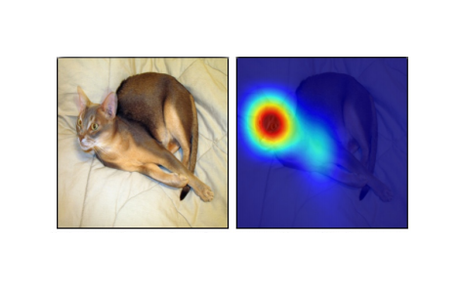
Another popular approach to CNN visualization is saliency maps. Saliency maps highlight the input pixels that have the greatest influence on the network‘s output for a given image. They provide a heatmap showing where the network is "looking" to make its prediction.
The most common method to compute saliency maps is to take the gradient of the predicted class score with respect to the input image. Let $S_c(x)$ be the score of class $c$ for input $x$. The saliency map is given by:
$$M_c(x) = \left| \frac{\partial S_c(x)}{\partial x} \right|$$
Intuitively, this gradient measures how much a small change in each input pixel would affect the class score. Pixels with large gradient magnitudes have a big impact on the prediction.
Here‘s an example saliency map for a CNN trained to classify scenes:

The saliency map highlights the key regions that the network uses to identify the scene as a kitchen, such as the stove, cabinets, and countertop. It provides some insight into the CNN‘s decision-making process.
However, saliency maps have some limitations and pitfalls to be aware of:
- They can be noisy and highlight irrelevant regions in addition to truly informative features
- They only visualize the local sensitivity of the class score, not the global importance of features
- They are not invariant to model implementation details and can vary significantly with small changes to the network architecture or training
Therefore, it‘s important to interpret saliency maps carefully and not draw too strong conclusions from them alone.
Feature Attribution
Saliency maps consider how each input pixel affects the output in isolation. But we often want to understand how interactions between features influence the network‘s predictions. Feature attribution methods aim to explain the output of a CNN in terms of the contribution of each input feature.
One popular approach is layer-wise relevance propagation (LRP). LRP assigns a relevance score to each neuron in the network, indicating how much it contributes to the final prediction. The relevance scores are propagated backwards from the output layer to the input image, preserving the total relevance at each layer.
Mathematically, let $R_i^{(l)}$ be the relevance score of neuron $i$ in layer $l$. The relevance scores are initialized at the output layer according to the predicted class scores:
$$R_i^{(L)} = S_c(x)$$
where $L$ is the total number of layers. The relevance scores are then propagated backwards using the following rule:
$$R_i^{(l)} = \sum_j \frac{ai^{(l)} w{ij}^{(l,l+1)}}{\sum_i ai^{(l)} w{ij}^{(l,l+1)}} R_j^{(l+1)}$$
where $ai^{(l)}$ is the activation of neuron $i$ in layer $l$ and $w{ij}^{(l,l+1)}$ is the weight connecting neuron $i$ in layer $l$ to neuron $j$ in layer $l+1$.
Here‘s an example of LRP applied to a CNN for image classification:

The LRP heatmap shows the positive (red) and negative (blue) contributions of each pixel to the predicted class. It provides a more fine-grained attribution of relevance than saliency maps.
However, LRP and other feature attribution methods also have limitations:
- The relevance scores can be sensitive to the choice of propagation rule and architecture details
- The visualizations can be noisy and difficult to interpret, especially for complex scenes
- The attribution of relevance to individual pixels may not always align with human intuition
As with all interpretability techniques, feature attribution should be used as part of a holistic analysis, not as a standalone explanation.
Interpretability Tools and Frameworks
Implementing CNN visualization techniques from scratch can be challenging, especially for complex architectures. Fortunately, there are several open-source tools and frameworks that make it easier to probe and interpret trained models.
Some of the most popular interpretability tools include:
-
Lucid: A collection of infrastructure and tools for research in neural network interpretability. Lucid provides a high-level API for activation maximization, feature visualization, and more.
-
CNN Explainer: An interactive visualization tool that lets you explore the activations and learned features of a CNN. CNN Explainer supports a variety of models and datasets.
-
ActiVis: A visual analytics system for interpreting deep learning models. ActiVis integrates multiple coordinated views to help users understand the relationships between neurons and features.
-
Tensorflow‘s What-If Tool: A tool for probing machine learning models and visualizing their performance on different subsets of data. The What-If Tool supports both local and global explanations.
-
Captum: An extensible library for model interpretability built on PyTorch. Captum provides a suite of algorithms for feature attribution, concept activation vectors, and more.
Using these tools can greatly streamline the process of generating and analyzing visualizations for your own models.
The Future of Explainable AI
While CNN visualization techniques have made significant progress in recent years, there is still a long way to go to achieve truly transparent and interpretable AI systems. Some of the key challenges and directions for future work include:
-
Developing more robust and faithful explanations: Current methods often produce noisy or misleading visualizations, especially for complex tasks and datasets. We need techniques that are more resilient to adversarial perturbations and better align with human reasoning.
-
Quantifying and benchmarking interpretability: There is a lack of standard evaluation metrics and datasets for assessing the quality of explanations. Developing rigorous methods to compare and validate interpretability techniques is crucial for progress in the field.
-
Jointly optimizing for performance and interpretability: There is often a trade-off between accuracy and interpretability in deep learning models. Exploring architectures and training methods that can achieve both state-of-the-art performance and clear explanations is an important direction.
-
Integrating interpretability into the model design process: Many current techniques are post-hoc, generating explanations after a model has already been trained. Developing methods to incorporate interpretability constraints and priors during training could lead to more inherently explainable models.
-
Bridging the gap between local and global explanations: Saliency maps and feature attribution provide local explanations for individual predictions, but understanding the global behavior of a model across an entire dataset is also important. Techniques like concept activation vectors and TCAV are promising approaches to link local attributions to human-interpretable concepts.
-
Tailoring explanations to different stakeholders: The most useful form of explanation may vary depending on the audience and use case. A machine learning engineer debugging a model needs different information than a doctor using the model to diagnose patients. Customizing explanations for different stakeholders is an important challenge.
-
Studying the societal impact of explainable AI: As interpretable AI systems are deployed in real-world applications, it‘s crucial to study their impact on fairness, accountability, and transparency. Explainable AI has the potential to build trust and identify biases, but it could also be misused to justify flawed or prejudiced decisions.
Addressing these challenges will require close collaboration between researchers in machine learning, human-computer interaction, and the social sciences. It will also require active engagement with policymakers, industry leaders, and the broader public to ensure that explainable AI technologies are developed and deployed responsibly.
Conclusion
Convolutional neural networks have achieved remarkable performance on a wide range of computer vision tasks, but their complexity and opacity remain major obstacles to widespread adoption in high-stakes applications. Visualization techniques like activation maximization, saliency maps, and feature attribution provide a window into the learned representations and decision-making processes of these powerful models.
While these techniques have limitations and challenges, they are invaluable tools for researchers and practitioners to debug models, identify potential failure modes and biases, and build more transparent and accountable AI systems. As the field of explainable AI continues to advance, we can expect to see more robust, faithful, and human-aligned explanations of CNN behavior.
However, it‘s important to recognize that interpretability is not a panacea. Even with perfectly transparent models, there will still be difficult ethical questions to grapple with as AI systems are deployed in the real world. Explainable AI should be seen as a key component of responsible AI development, not an end in itself.
As deep learning continues to transform every aspect of our lives, it‘s crucial that we develop models that are not only accurate, but also interpretable, reliable, and accountable. Visualization techniques for CNNs are an important step towards this goal, but there is still much work to be done. It will require sustained effort and collaboration from researchers, practitioners, policymakers, and society as a whole to ensure that the benefits of AI are realized in a way that is transparent, equitable, and aligned with human values.