
Leveraging Machine Learning to Evaluate and Improve Education Quality in India
India has made significant strides in expanding access to education in recent decades. The literacy rate has increased from 64.8% in 2001 to 74.4% in 2018, with over 260 million children enrolled in school.[^1] However, the quality of education remains a persistent challenge, with wide disparities between states and social groups.
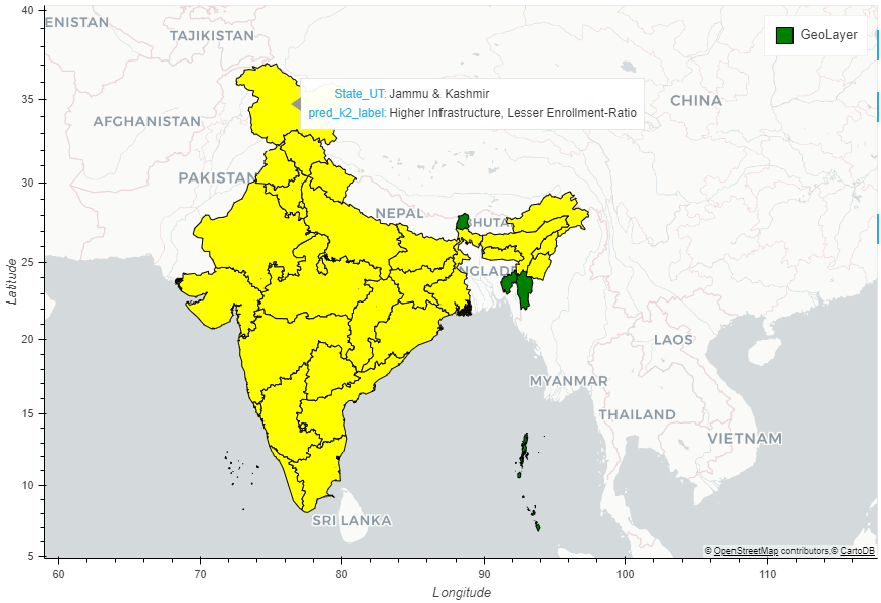
In this article, we demonstrate how unsupervised machine learning techniques like clustering can be used to evaluate the quality of school education across Indian states. By identifying states facing similar challenges, policymakers can design evidence-based interventions to improve learning outcomes and bridge the education divide.
Understanding Clustering Algorithms
Clustering is a family of techniques that group together data points based on their inherent similarities or distances in a multi-dimensional space.[^2] The goal is to maximize homogeneity within clusters and heterogeneity between clusters. Some common types of clustering algorithms are:
- Centroid-based: Assigns data points to the nearest cluster center or centroid (e.g. K-Means, K-Medoids)
- Density-based: Groups together data points in high-density regions separated by low-density regions (e.g. DBSCAN)
- Distribution-based: Assumes that the data is generated from a mixture of probability distributions (e.g. Gaussian Mixture Models)
- Hierarchical: Builds a tree-like structure of clusters, either by merging smaller clusters into larger ones (agglomerative) or dividing larger clusters into smaller ones (divisive)
For this analysis, we focus on two popular algorithms – K-Means and Hierarchical Agglomerative Clustering. K-Means is a centroid-based algorithm that iteratively assigns data points to K clusters based on their Euclidean distances from the cluster centroids. The centroids are then recomputed based on the new cluster assignments until convergence.[^3]
Agglomerative Clustering, on the other hand, starts by treating each data point as a singleton cluster and then recursively merges the closest pair of clusters until the desired number of clusters is reached. The proximity between clusters is defined by a linkage criterion such as Ward‘s method, which minimizes the within-cluster variance.[^4]
Dataset and Feature Selection
We compiled a comprehensive dataset of education indicators for 36 states and union territories of India, averaged over a three-year period from 2017-18 to 2019-20. The data was sourced from UDISE, NAS, and Economic Survey reports.
The raw dataset included over 250 parameters related to enrollment, dropout, infrastructure, teachers, learning outcomes, and expenditure. To select the most relevant features for clustering, we followed a three-step process:
- Domain expertise: We consulted with education researchers and policymakers to identify the key indicators that define education quality and are actionable from a policy perspective.
- Statistical analysis: We computed the correlation matrix and variance inflation factors (VIF) to remove highly correlated or redundant features.
- Dimensionality reduction: We applied principal component analysis (PCA) and t-distributed stochastic neighbor embedding (t-SNE) to identify the latent structure of the data and visualize it in lower dimensions.
After feature selection, we arrived at a set of 18 parameters covering the critical aspects of education quality:
| Parameter | Description |
|---|---|
| Gross Enrollment Ratio (Primary) | Enrollment as a % of the official primary school-age population |
| Gross Enrollment Ratio (Upper Primary) | Enrollment as a % of the official upper primary school-age population |
| Gross Enrollment Ratio (Secondary) | Enrollment as a % of the official secondary school-age population |
| Dropout Rate (Primary) | Proportion of students dropping out before completing primary education |
| Dropout Rate (Upper Primary) | Proportion of students dropping out before completing upper primary education |
| Dropout Rate (Secondary) | Proportion of students dropping out before completing secondary education |
| Schools with Drinking Water (%) | Percentage of schools with a functional drinking water facility |
| Schools with Electricity (%) | Percentage of schools with an electricity connection |
| Schools with Computers (%) | Percentage of schools with functioning computer facilities |
| Schools with Boy‘s Toilet (%) | Percentage of schools with separate toilet facilities for boys |
| Schools with Girl‘s Toilet (%) | Percentage of schools with separate toilet facilities for girls |
| Pupil Teacher Ratio (Primary) | Average number of students per teacher in primary schools |
| Pupil Teacher Ratio (Secondary) | Average number of students per teacher in secondary schools |
| NAS Score (Grade 3) | Average score in Language, Maths and EVS in the National Achievement Survey |
| NAS Score (Grade 5) | Average score in Language, Maths and EVS in the National Achievement Survey |
| NAS Score (Grade 8) | Average score in Language, Maths and Science in the National Achievement Survey |
| Transition Rate (Primary to Upper Primary) | Percentage of students transitioning from primary to upper primary |
| Transition Rate (Upper Primary to Secondary) | Percentage of students transitioning from upper primary to secondary |
Before proceeding with clustering, we standardized the data using Z-score normalization to remove the effect of different scales and ranges.
Selection of Optimal Number of Clusters
A critical hyperparameter in clustering is the number of clusters (K) to extract from the data. We used a combination of heuristic and statistical methods to determine the optimal K:
-
Elbow Method: We plotted the Within-Cluster Sum of Squared Distances (WCSS) for K ranging from 1 to 10. The elbow point suggests the optimal K based on the rate of decrease in WCSS.
-
Silhouette Analysis: The silhouette coefficient measures how well each data point fits into its assigned cluster compared to other clusters. We computed the average silhouette score for different values of K.
-
Gap Statistic: This method compares the within-cluster dispersion to its expected value under a null reference distribution. The optimal K is where the gap between the observed and expected dispersion is largest.
-
Domain knowledge: We also considered the interpretability and actionability of the clusters for policy purposes.
Based on the above analysis, we selected K=4 for the K-Means algorithm and K=5 for Agglomerative Clustering.
Clustering Results and Interpretation
The K-Means algorithm grouped the states into the following four clusters:
Cluster 1 (9 states): Andhra Pradesh, Assam, Bihar, Jharkhand, Madhya Pradesh, Odisha, Rajasthan, Telangana, Uttar Pradesh
- Characteristics: Low enrollment and high dropout rates, poor infrastructure, low learning outcomes, low spending
- Challenges: Poverty, social exclusion, teacher shortages, low parental involvement
Cluster 2 (11 states): Arunachal Pradesh, Chhattisgarh, Haryana, Himachal Pradesh, Jammu and Kashmir, Meghalaya, Nagaland, Punjab, Tripura, Uttarakhand, West Bengal
- Characteristics: Moderate enrollment and dropout rates, average infrastructure, moderate learning outcomes, average spending
- Challenges: Difficult terrain, weak governance, inadequate teacher training
Cluster 3 (10 states): Goa, Gujarat, Karnataka, Kerala, Maharashtra, Manipur, Mizoram, Sikkim, Tamil Nadu, Delhi
- Characteristics: High enrollment and low dropout rates, good infrastructure, high learning outcomes, high spending
- Challenges: Inequalities within states, lack of innovation, low use of technology
Cluster 4 (6 UTs): Andaman & Nicobar, Chandigarh, Dadra & Nagar Haveli, Daman & Diu, Lakshadweep, Puducherry
- Characteristics: Very high enrollment and very low dropout rates, excellent infrastructure, very high learning outcomes, very high spending
- Challenges: Small population sizes, limited higher education options
The Agglomerative Clustering results were largely similar, with a few states like Haryana and Mizoram shifting between adjacent clusters.
To validate the clustering results, we compared them with existing categorizations like the NITI Aayog‘s School Education Quality Index (SEQI).[^5] The SEQI 2019 ranks states based on learning outcomes, access, infrastructure, and governance indicators. We found a strong correlation (Pearson‘s r = 0.79) between the SEQI ranks and our cluster assignments, confirming the validity of the clustering approach.
However, there were also some notable differences. For example, Punjab and Haryana are ranked much higher in the SEQI than in our analysis. This could be because the SEQI gives more weightage to governance factors like teacher availability and administrative efficiency, which may not directly impact learning outcomes.
Another interesting finding is that the clustering results do not neatly align with the usual socio-economic and regional divisions in India. For instance, the top-performing Cluster 3 includes states from the north (Himachal Pradesh), east (Sikkim), west (Maharashtra), and south (Kerala). Similarly, the bottom-performing Cluster 1 has states from the north (Uttar Pradesh), east (Bihar), west (Rajasthan), and south (Andhra Pradesh).
This suggests that education quality is influenced by a complex interplay of factors beyond just economic development or geography. States with similar challenges may benefit from learning from each other‘s successful interventions.
Policy Recommendations
Based on the unique characteristics and challenges of each cluster, we propose the following targeted policy interventions:
Cluster 1 States:
- Increase spending on education infrastructure, teacher recruitment, and training
- Provide conditional cash transfers and scholarships to incentivize enrollment and retention
- Involve community organizations and volunteers to support school management and monitoring
- Implement remedial education programs to help students catch up on basic skills
- Expand access to early childhood education to build school readiness
Cluster 2 States:
- Improve transport and residential facilities in remote areas to reduce dropout rates
- Use technology-based solutions to deliver teacher training and learning content
- Introduce vocational education and soft skills training to enhance employability
- Strengthen school management committees and grievance redressal mechanisms
- Conduct regular learning assessments and use data to inform teaching practices
Cluster 3 States:
- Focus on improving learning outcomes for disadvantaged groups within the states
- Encourage experimentation and innovation in pedagogy, curriculum, and assessment
- Promote the use of digital tools and personalized learning platforms
- Foster partnerships with universities and industry for research and skill development
- Invest in teacher professional development and performance-based incentives
Cluster 4 UTs:
- Develop specialized programs in niche areas like marine biology, tourism, and IT
- Provide scholarships for students to pursue higher education in the mainland
- Attract high-quality teachers through financial and non-financial incentives
- Leverage the UTs as test beds for piloting new education policies and practices
- Promote cross-cultural learning and exposure through student and teacher exchange programs
In addition to cluster-specific interventions, there are also some cross-cutting reforms needed at the national level:
- Increase public spending on education to the recommended 6% of GDP
- Implement a national curriculum framework that focuses on holistic learning outcomes
- Strengthen teacher education institutions and introduce performance-based certification
- Leverage AI and big data analytics to monitor education quality and target resources
- Foster a culture of research and evidence-based policymaking in education
Conclusion
This analysis demonstrates the power of unsupervised learning techniques like clustering in uncovering patterns and insights from complex education data. By grouping states based on their performance on key indicators, policymakers can prioritize interventions and allocate resources more effectively.
However, it is important to note that clustering is just one of many possible lenses to evaluate education systems. Other factors like equity, social inclusion, and citizenship values also need to be considered in a holistic education quality framework.
Moreover, the success of any education reform depends on effective implementation and monitoring at the grassroots level. Clustering can help identify ‘bright spots‘ – states or districts that have achieved exceptional outcomes despite facing similar challenges as their peers. Documenting and scaling up these success stories can provide valuable lessons for other contexts.
Ultimately, improving education quality is a long-term endeavor that requires sustained political commitment, evidence-based policies, and multi-stakeholder partnerships. With over 250 million children‘s futures at stake, it is a moral and economic imperative for India to provide equitable access to high-quality education for all. Machine learning techniques like clustering can be a valuable tool in this pursuit.
[^1]: Government of India, Ministry of Education. (2020). National Education Policy 2020.[^2]: Jain, A. K., Murty, M. N., & Flynn, P. J. (1999). Data clustering: a review. ACM computing surveys (CSUR), 31(3), 264-323.
[^3]: Arthur, D., & Vassilvitskii, S. (2006). k-means++: The advantages of careful seeding. Stanford Infolab.
[^4]: Ward Jr, J. H. (1963). Hierarchical grouping to optimize an objective function. Journal of the American statistical association, 58(301), 236-244.
[^5]: NITI Aayog, Government of India. (2019). School Education Quality Index.


