
Powering A/B Tests with Chi-Square: An In-Depth Guide for AI and ML Practitioners
Introduction
A/B testing is a cornerstone of data-driven decision making, allowing us to optimize everything from website designs to machine learning models. By randomly exposing users to different variations, we can measure the impact on key metrics and determine which variant performs best.
However, the success of A/B testing hinges on applying the right statistical methods to analyze the results. Many data scientists default to using a t-test, but this assumes normally distributed data and can only compare means between two groups. For the categorical data that frequently arises in A/B tests (e.g. click-through rates), the chi-square test is often a better choice.
In this guide, we‘ll take a deep dive into the theory and practice of using chi-square for A/B testing, with a focus on applications in artificial intelligence (AI) and machine learning (ML). We‘ll cover the mathematical underpinnings, walk through some concrete examples in Excel and Python, and discuss key considerations like sample size and effect size. Finally, we‘ll explore how chi-square fits into a broader experimentation framework and its connections to core AI/ML concepts.
Whether you‘re a data scientist, ML engineer, or growth marketer, this guide will give you the knowledge and tools to power up your A/B tests with chi-square. Let‘s jump in!
Chi-Square: The Statistic, the Test, and the Distribution
Before we get into the nitty-gritty of A/B testing, let‘s review what the chi-square statistic actually measures and where it comes from.
The chi-square statistic is a measure of how much observed frequencies deviate from expected frequencies if there were no association between categorical variables. It‘s calculated as:
$$\chi^2 = \sum_{i=1}^{n} \frac{(O_i – E_i)^2}{E_i}$$
Where:
- $O_i$ is the observed frequency for cell $i$
- $E_i$ is the expected frequency for cell $i$ under the null hypothesis of independence
- $n$ is the total number of cells in the contingency table
The expected frequencies $E_i$ are calculated from the marginal totals of the contingency table, using the formula:
$$E_i = \frac{\text{row total}_i * \text{column total}_i}{\text{grand total}}$$
Importantly, the chi-square statistic follows a specific probability distribution known as the chi-square distribution. This distribution arises as the sum of the squares of independent standard normal random variables. It‘s parameterized by a single value called "degrees of freedom", which is calculated as:
$$ df = (r-1) * (c-1) $$
Where:
- $r$ is the number of rows in the contingency table
- $c$ is the number of columns
The chi-square test uses this distribution to determine the probability (p-value) of observing a chi-square statistic at least as extreme as the one calculated from the data, assuming the null hypothesis is true. If the p-value is below a pre-defined significance level (often 0.05), we reject the null hypothesis of independence and conclude the variables are associated.
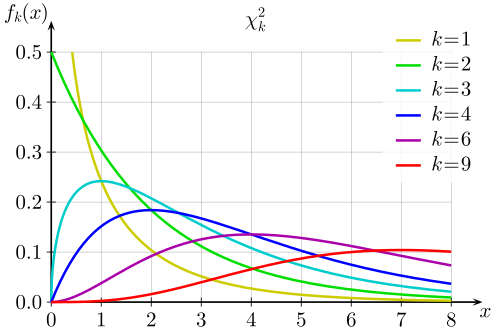
Image source: Wikipedia
With that statistical foundation in place, let‘s see how to apply chi-square to A/B testing.
A/B Testing with Chi-Square: An Example
Consider an e-commerce company running an A/B test on two different checkout page designs. After randomly splitting traffic between the designs for two weeks, they observe the following purchase totals:
| Design A | Design B | |
|---|---|---|
| Purchases | 512 | 489 |
| No Purchases | 6,203 | 6,796 |
To determine if there‘s a significant association between checkout design and purchase rate, we‘ll run a chi-square test.
Step 1: State the hypotheses
- Null hypothesis: Purchase rate is independent of checkout design
- Alternative hypothesis: Purchase rate is associated with checkout design
Step 2: Calculate expected frequencies
Using the expected frequency formula from before, we get:
| Design A | Design B | |
|---|---|---|
| Purchases | 486 | 515 |
| No Purchases | 6,229 | 6,770 |
Step 3: Calculate the chi-square statistic
Plugging the observed and expected values into the chi-square formula:
$$\chi^2 = \frac{(512-486)^2}{486} + \frac{(489-515)^2}{515} + \frac{(6203-6229)^2}{6229} + \frac{(6796-6770)^2}{6770} = 2.617$$
With 1 degree of freedom, since the contingency table has 2 rows and 2 columns.
Step 4: Find the p-value
Looking up the chi-square statistic of 2.617 with 1 degree of freedom in a chi-square table or using Excel‘s CHISQ.DIST.RT function, we get a p-value of 0.106.
Step 5: Draw a conclusion
Since the p-value is greater than 0.05, we fail to reject the null hypothesis. There is not sufficient evidence to conclude that purchase rates differ between the two checkout page designs.
Running Chi-Square in Python and Excel
In practice, you‘ll likely use software to run chi-square tests rather than calculating the statistic by hand. Here‘s how to do it in Python and Excel.
Python
The scipy.stats module provides a chi2_contingency function that takes a contingency table and returns the chi-square statistic, p-value, degrees of freedom, and expected frequencies:
from scipy.stats import chi2_contingency

observed = [[512, 6203],
            [489, 6796]]

chi2, p, dof, expected = chi2_contingency(observed)

print(f"Chi-square statistic: {chi2:.3f}")
print(f"P-value: {p:.3f}")
Output:
Chi-square statistic: 2.617
P-value: 0.106
Excel
In Excel, you can use the CHISQ.TEST function to directly calculate the p-value from the observed and expected frequency ranges:
=CHISQ.TEST(A2:B3, D2:E3)Where A2:B3 contains the observed frequencies and D2:E3 contains the expected frequencies.

Image source: Ablebits
Considerations for Using Chi-Square
While chi-square is a versatile and powerful tool for analyzing A/B tests, there are a few key things to keep in mind:
Sample Size and Power
The reliability of the chi-square test depends on having a sufficiently large sample size. A common rule of thumb is that the expected frequency should be at least 5 for each cell in the contingency table. With smaller samples, the p-values may be inaccurate and the test will have lower statistical power to detect real differences.
On the other hand, with very large samples, even tiny, practically insignificant differences can be flagged as statistically significant. Always consider the practical significance of your results in addition to statistical significance.
Effect Size
The chi-square test only tells you if there‘s a significant association between variables, not the strength of that association. To quantify the effect size, you can use metrics like the phi coefficient or Cramer‘s V. These range from 0 to 1, with higher values indicating a stronger association.
In Python, you can calculate the phi coefficient from the chi-square statistic as:
from scipy.stats import chi2_contingency

observed = [[512, 6203],
            [489, 6796]]

chi2, p, dof, expected = chi2_contingency(observed)

n = observed[0][0] + observed[0][1] + observed[1][0] + observed[1][1]
phi = (chi2 / n)**0.5

print(f"Phi coefficient: {phi:.3f}")
Output:
Phi coefficient: 0.020A phi coefficient of 0.02 indicates a very weak association between checkout design and purchase rate in this example.
Multiple Comparisons
If you‘re running multiple A/B tests simultaneously, you may need to adjust your significance threshold to control the overall false positive rate. Techniques like the Bonferroni correction or Benjamini-Hochberg procedure can help limit the chance of finding spurious significant results.
Chi-Square vs. Other Methods
The chi-square test of independence is not the only way to analyze categorical data from A/B tests. Some other common methods include:
-
Fisher‘s exact test: An alternative to chi-square for small samples that calculates the exact p-value rather than relying on the chi-square approximation. Computationally intensive for large tables.
-
Z-test of proportions: Compares two population proportions to see if they‘re significantly different. Can be used when you have only one categorical variable with two levels (e.g. click vs. no click).
-
Logistic regression: Models the probability of a binary outcome based on one or more categorical or continuous predictors. Useful for understanding the impact of multiple factors on a conversion rate.
Each method has its own strengths and assumptions, so the best choice depends on your specific data and research question.
Chi-Square and AI/ML Experimentation
So far we‘ve focused on using chi-square for traditional A/B tests, but it‘s also a valuable tool for evaluating machine learning models. ML models often have categorical outputs, like classification labels or recommendations. In an ML experimentation framework, the general steps are:
- Define control and treatment versions of your ML model (e.g. with different architectures, hyperparameters, or training data)
- Randomly split real traffic or users into control and treatment groups
- Expose each group to the ML model predictions
- Measure the relevant metrics (e.g. click-through rate on recommended items)
- Analyze the results with a chi-square test
This process allows you to validate that changes to your model yield tangible improvements in the product before deploying them to all users.
From a statistical perspective, ML experimentation has a lot in common with traditional hypothesis testing. The chi-square test is essentially answering the question: is our observed data probable under the null hypothesis that the ML model variations perform equally, or more consistent with the alternative that they have different impacts?
Thinking of model evaluation through the lens of statistical tests like chi-square can help ensure rigorous, reliable results that drive better decisions and customer experiences.
Conclusion
We‘ve covered a lot of ground in this guide, from the theoretical foundations of the chi-square statistic to practical applications and considerations for A/B testing and ML experimentation.
To recap some key points:
- The chi-square test is a robust way to analyze categorical metrics from A/B tests, without making assumptions about the data distribution
- Calculating the chi-square statistic boils down to comparing observed and expected cell frequencies in a contingency table
- Python and Excel make it easy to run chi-square tests on real data
- Chi-square is just one tool in the experimentation toolbox; it‘s important to choose the right method for the situation and research question
- Sample size, effect size, and multiple comparisons are all important considerations when running and interpreting chi-square tests
- The same statistical principles that underpin traditional A/B testing also apply to evaluating ML models in an online experimentation framework
Equipped with this knowledge, you‘re well on your way to designing and analyzing successful experiments and driving meaningful product improvements informed by data. Go forth and explore!


