Intuition Behind Correlation: Definition and Types

What is Correlation?
Correlation is a statistical measure that describes the relationship between two variables. It measures whether and how strongly pairs of variables are related.
For example, consider the variables of hours spent studying and exam scores. We expect a positive correlation – more hours studying is associated with higher exam scores. Height and weight are another classic example of positively correlated variables.
Negative correlations are also common. Consider outdoor temperature and sales of winter coats – as temperature drops, coat sales increase. Hours of sleep and cups of coffee consumed is another negatively correlated pair.
Some variables have no discernable relationship. Favorite ice cream flavor and math ability are unlikely to be correlated.
Mathematical Definition
The most common mathematical definition of correlation is the Pearson correlation coefficient. For two variables X and Y, it‘s defined as:
$$ \rho_{X,Y} = \frac{cov(X,Y)}{\sigma_X \sigma_Y} = \frac{E[(X-\mu_X)(Y-\mu_Y)]}{\sigma_X \sigma_Y} $$
Where:
- $cov(X,Y)$ is the covariance between $X$ and $Y$
- $\sigma_X$ and $\sigma_Y$ are the standard deviations of $X$ and $Y$
- $E$ is the expectation operator
- $\mu_X$ and $\mu_Y$ are the means of $X$ and $Y$
The Pearson coefficient $\rho$ always falls between -1 and 1:
- $\rho = 1$ indicates a perfect positive linear relationship
- $\rho = -1$ indicates a perfect negative linear relationship
- $\rho = 0$ indicates no linear relationship
Interestingly, the Pearson coefficient is symmetric: $\rho{X,Y} = \rho{Y,X}$.
Properties of Correlation
Correlation has several important properties:
-
Correlation is standardized and unitless. The units of measurement of the original variables do not affect the correlation.
-
Correlation is sensitive to linear relationships. It may not capture nonlinear relationships, even if they are strong.
-
Correlation is symmetric. The correlation of X with Y is the same as of Y with X.
-
Correlation is sensitive to outliers. A single outlier can substantially impact the correlation coefficient.
-
Correlation does not imply causation. A strong correlation between X and Y does not necessarily mean X causes Y or vice versa.
Correlation vs Causation
A critical point about correlation is that it does not imply causation. Two variables can be strongly correlated without one causing the other.
Classic examples include:
- Number of firefighters at a fire and amount of damage done. More firefighters are associated with more damage, but they do not cause the damage. The size of the fire is a confounding variable.
- Ice cream sales and shark attacks. Both increase together, but eating ice cream does not cause shark attacks. The confounding variable is summer weather – warm weather increases both ice cream sales and swimming, which increases shark attack risk.
Establishing causality requires carefully designed experiments and cannot be concluded from correlation alone. Techniques like randomized controlled trials, Granger causality, and causal inference algorithms are used to determine causality.
Types of Correlation
We can categorize correlations in several ways:
Sign of Correlation
- Positive correlations: Both variables move in the same direction. Higher values of one are associated with higher values of the other.
- Negative correlations: Variables move in opposite directions. Higher values of one are associated with lower values of the other.
Linearity
- Linear correlations: The relationship between the variables follows a straight line.
- Nonlinear correlations: The relationship is not linear, even if it is strong. For example, the relationship between age and height is nonlinear.
Number of Variables
- Simple correlation: The correlation between just two variables.
- Multiple correlation: The correlation between one variable and a combination of several others.
- Partial correlation: The correlation between two variables, controlling for the effects of one or more additional variables.
Calculating Correlation in Python
Python‘s data science libraries make calculating correlation coefficients straightforward. Here‘s how to calculate Pearson correlation with NumPy:
import numpy as np

x = [1, 2, 3, 4, 5]
y = [2, 4, 5, 4, 6]

corr_coef = np.corrcoef(x, y)[0,1]
print(corr_coef)  # Output: 0.8953
And with Pandas dataframes:
import pandas as pd

data = {‘hours_studied‘: [2, 3, 5, 8, 10],
        ‘exam_score‘: [52, 72, 78, 86, 90]}

df = pd.DataFrame(data)
print(df.corr())
Output:
             hours_studied  exam_score
hours_studied      1.000000    0.981370
exam_score         0.981370    1.000000
Correlation in Machine Learning
Correlation is a foundational concept in machine learning with several key applications.
Feature Selection
In machine learning datasets with many features, some features are often redundant – they provide the same information. Including redundant features can increase model complexity without improving performance.
Correlation is used to identify redundant features. If two features are very strongly correlated, one can likely be removed without losing much information. Heatmaps of the correlation matrix are a useful tool for visualizing clusters of correlated features.

A correlation matrix heatmap. Strongly positively correlated variables are red, strongly negatively correlated are blue. Image Source
Correlation-based feature selection algorithms automatically select a subset of features that are mutually uncorrelated but correlated with the target variable.
Correlation as Similarity
Correlation coefficients are also used as similarity measures. For example, item-item collaborative filtering recommender systems suggest items to users based on their similarity to other items the user has liked. This similarity is often measured by correlation – items are recommended if they have high correlation with a user‘s previously liked items.
In bioinformatics, gene co-expression networks are constructed by calculating correlations between gene expression levels. Genes with high correlations are connected in the network, identifying functional modules and regulatory relationships.
Maximal Information Coefficient
While Pearson correlation captures linear relationships, many real-world datasets have nonlinear relationships. The maximal information coefficient (MIC) is a correlation measure designed to capture both linear and nonlinear associations.
MIC uses mutual information to measure the strength of the relationship between two variables. It ranges from 0 (no relationship) to 1 (perfect relationship, either linear or nonlinear). In Python, the minepy library implements MIC:
from minepy import MINE

mine = MINE()
mine.compute_score(x, y)
mic = mine.mic()
MIC is particularly useful in feature selection when relationships may be nonlinear.
Model Interpretability
Correlation is also important for model interpretability. While complex black box models like deep neural networks can achieve high accuracy, their decision making is opaque. Simpler models like linear regression are more interpretable because the model coefficients directly correspond to the strength and direction of the relationship between each feature and the target.
Partial dependence plots and individual conditional expectation plots visualize the marginal effect of a single feature on the model‘s predictions, assuming all other features are held constant. These plots are another way to interpret the relationships the model has learned.
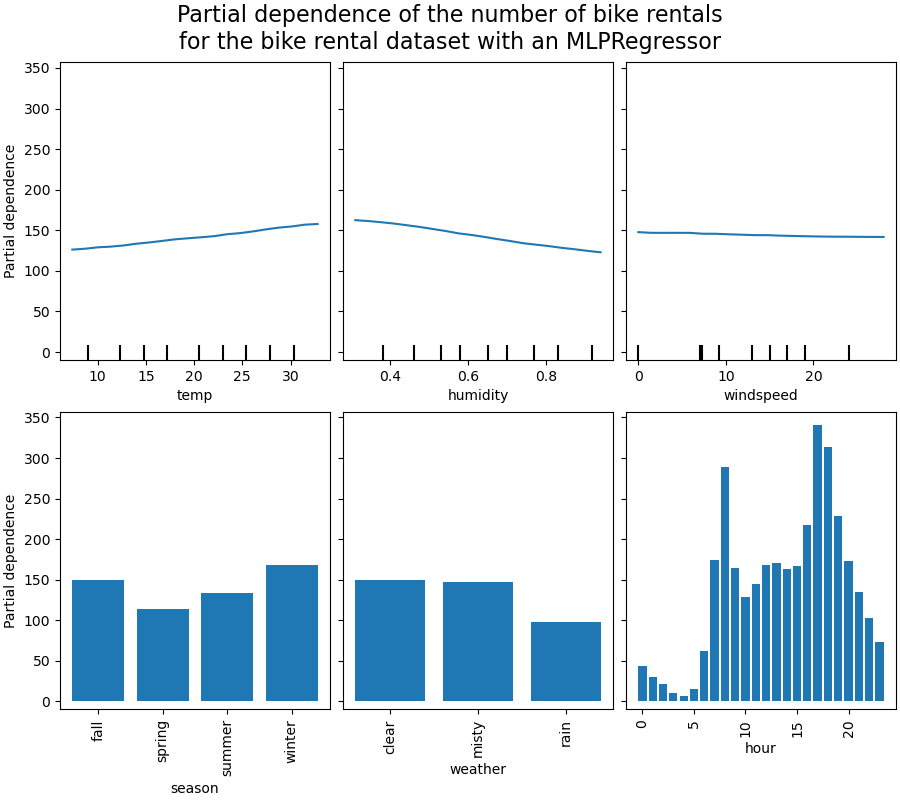
A partial dependence plot showing the marginal effect of a feature on a model‘s predicted probability. Image Source
Correlation in Deep Learning
Deep learning models learn hierarchical representations of data, transforming raw input into higher level abstractions. The representations learned by deep models exhibit interesting correlation structures.
In natural language processing, word embeddings are dense vector representations of words learned from text corpora. Words that frequently appear in similar contexts have embedding vectors with high correlation. This captures semantic relationships – synonyms have highly correlated embeddings, while antonyms have negatively correlated embeddings.

Correlation matrix of word embeddings. Semantically similar words have correlated embeddings. Image Source
Similar patterns emerge in computer vision. Deep convolutional networks trained on image classification learn hierarchical feature detectors – early layers detect simple features like edges and colors, while later layers detect complex features like objects and faces. Neurons that detect similar features have correlated activations across images.
Representation learning and transfer learning rely on this property – models pretrained on large diverse datasets learn general purpose representations that transfer to specific downstream tasks. The correlated representations learned on the pretraining task encode generally useful features.
Limitations of Correlation
While powerful, correlation has several important limitations:
-
Correlation measures the strength of the relationship, but says nothing about causality. Controlled experiments are necessary to establish causal links.
-
Pearson correlation only captures linear relationships. It can miss strong nonlinear relationships. Rank-based correlations like Spearman‘s $\rho$ or Kendall‘s $\tau$ can capture monotonic nonlinear relationships.
-
Correlation is sensitive to outliers. A single extreme outlier can dramatically change the correlation coefficient. Robust statistics and visualization are important to check for outlier influence.
-
Correlation assumes data is normally distributed. It can be misleading for heavily skewed or bounded distributions. Transformations like log scaling can help, but it‘s important to check distributional assumptions.
-
Statistical significance of correlations depends on sample size. Large samples can have statistically significant but practically insignificant correlations. Always consider practical significance alongside statistical significance.
-
Correlation can be confounded by other variables. Partial correlation controlling for confounders can give a clearer picture of the direct relationship between two variables.
Current Research and Applications
Current research on correlation spans theory and applications across fields.
In neuroscience, functional MRI studies measure correlations in brain activity over time. Regions with correlated activity form functional networks involved in cognition, attention, sensory processing, etc. Advanced techniques like psychophysical interaction and dynamic causal modeling aim to move from correlations to causal models of brain dynamics.
Friston, K. J. (2011). Functional and effective connectivity: a review. Brain connectivity, 1(1), 13-36.
Climatologists use spatial and temporal correlations to characterize patterns in climate data. Teleconnections are correlations between climate anomalies in distant parts of the world, like the El Niño Southern Oscillation. Climate networks model the Earth‘s climate as a complex network with edges weighted by correlations between locations.
Donges, J. F., Zou, Y., Marwan, N., & Kurths, J. (2009). Complex networks in climate dynamics. The European Physical Journal Special Topics, 174(1), 157-179.
In bioinformatics, correlation networks are used to infer gene regulatory networks and protein interaction networks from high throughput omics data. Partial correlation and information theoretic approaches are used to identify direct vs indirect relationships.
Friedman, J., Hastie, T., & Tibshirani, R. (2008). Sparse inverse covariance estimation with the graphical lasso. Biostatistics, 9(3), 432-441.
In finance, correlations between asset returns are central to portfolio optimization and risk management. However, financial correlations are notoriously unstable over time. Techniques from random matrix theory are used to denoise correlation matrices for more stable risk estimates.
Laloux, L., Cizeau, P., Bouchaud, J. P., & Potters, M. (1999). Noise dressing of financial correlation matrices. Physical review letters, 83(7), 1467.
Machine learning research continues to develop new correlation measures for complex data types. The Hirschfeld-Gebelein-Rényi Maximum Correlation Coefficient is a correlation measure for multivariate, nonlinear, and non-normally distributed data based on the concept of maximal correlation from information theory.
Huang, S. Y., Lee, M. H., & Hsiao, C. K. (2009). Nonlinear measures of association with kernel canonical correlation analysis and applications. Journal of statistical planning and inference, 139(7), 2162-2174.
In summary, correlation is a simple yet powerful tool for understanding relationships in data. While it has limitations, ongoing research is extending correlation to handle increasingly complex data across diverse domains. A solid grasp of correlation is essential for data scientists applying machine learning to uncover insights and drive decisions from data.