MLOps Part 3: Model Deployment and Model Monitoring
Introduction
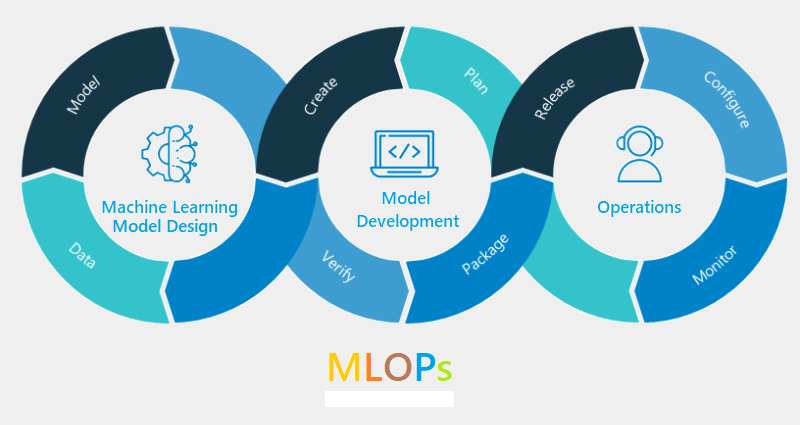
Welcome to the third installment in our series on Machine Learning Operations (MLOps). In Part 1, we introduced the concepts and motivations behind MLOps. Part 2 covered the model building phase, including training, testing, packaging, and registering ML models. Now in Part 3, we‘ll dive into the crucial topics of model deployment and ongoing monitoring in production.
Deploying models to serve predictions in the real world and monitoring their behavior is essential for any successful machine learning application. Simply building a model is not enough – we need robust systems to integrate the model, handle the deployment process, monitor the live system, and maintain the model over its lifecycle as data changes. Let‘s examine these aspects in more detail.
Model Deployment
Model deployment is the process of integrating a trained ML model into an application to serve predictions, usually via a REST API or streaming service. The model deployment pipeline typically consists of two key steps: application testing and the production release.
Application Testing
Before pushing a model all the way to production serving live traffic, it‘s important to validate its performance and behavior in an environment that mimics production. The application testing step aims to evaluate the model as part of an integrated application in a production-like setting, often called a staging environment.
Beyond just measuring the raw predictive performance metrics like we did during initial model testing, we stress test the model‘s robustness, reliability, and scalability under more realistic conditions. Key aspects to validate include:
- End-to-end functional correctness of the application
- Latency and throughput at expected traffic volumes
- Graceful handling of error cases and outlier data
- Resource usage and efficiency at scale
- Integration with other components and data sources
Automated testing, load testing, shadow testing, and canary releases are useful techniques to progressively roll out the model to staging while mitigating risk. Only after the model has been thoroughly vetted and approved in the staging environment is it ready to be promoted to production.
Production Release
Once a model has passed the application testing gauntlet, the final step is to deploy it to the actual production environment to serve live inference requests. In modern MLOps stacks, this is typically accomplished using a Continuous Integration/Continuous Delivery (CI/CD) pipeline.
CI/CD is a DevOps practice that automates the integration, testing, and deployment of code changes. Check-ins to the central code repository trigger automated pipelines that build the application, run unit and integration tests, and progressively promote the build through environments upon success at each stage.
For machine learning models, the CI/CD pipeline might include steps like:
- Pulling the packaged model artifact from the model registry
- Building a Docker container with the model and HTTP server
- Pushing the container to a container registry
- Deploying the container to a staging environment
- Running automated tests and checks in staging
- Manually approving the release to production
- Deploying the container to the production cluster
- Monitoring the rollout and rolling back if issues arise
With a battle-tested CI/CD pipeline in place, new models can be deployed to production with velocity and confidence. The CI/CD system forms the critical glue between the model development and model operation phases.
Model Monitoring
Deploying a model to production is a major milestone, but the work doesn‘t end there. ML models can behave in unexpected ways when exposed to live data, and their performance naturally degrades over time as data drifts and the world changes. Model monitoring is the practice of continuously tracking the behavior of models in production to ensure reliability, performance, and correctness.
What to Monitor
There are several key aspects to monitor for production ML models:
-
Data Quality: Monitoring the distributions and quality of input features over time to detect data drift, anomalies, or issues with data pipelines. Common statistics to track include feature means, medians, min/max values, and frequencies of categorical values.
-
Model Performance: Tracking the overall predictive performance of the model on live data, in terms of metrics like accuracy, F1 score, AUC, RMSE, etc. This is challenging since ground truth labels are often not available in real-time. Techniques like a canary model or human-in-the-loop labeling can help.
-
Model Fairness: Evaluating the model‘s performance across different slices of data to ensure fairness and identify potential bias issues. Monitoring metrics like equality of opportunity and demographic parity can surface troubling disparities.
-
Operational Metrics: Tracking operational metrics for the model service, such as latency, throughput, error rates, uptime, and resource utilization. Setting thresholds on these metrics can trigger alerts to proactively resolve issues.
-
Business Metrics: Measuring the actual business impact driven by the model‘s predictions, such as engagement, revenue, or customer satisfaction. Ultimately, these are the metrics that matter most.
Analyzing Results
Collecting monitoring data is just the first step. The next challenge is to surface meaningful insights from the flood of telemetry. Techniques from statistics, anomaly detection, and data visualization help identify issues amidst the noise.
Some common analytical techniques for model monitoring include:
- Setting thresholds and alerts on key metrics
- Detecting outliers and anomalies in the data and metrics
- Comparing models across time periods or data slices
- Visualizing metrics in dashboards for at-a-glance insights
- Applying statistical tests to quantify changes and their significance
Effective model monitoring turns data into decisions. Analysis helps prioritize the highest-leverage issues to address.
Taking Action
The final step of the model monitoring loop is to decide on the appropriate action to maintain or improve the live model. Potential actions include:
- Retraining the model on fresher data if performance degrades
- Switching to a different model version if a better one is available
- Adjusting the model decision threshold to optimize metrics
- Routing data to a human fallback system if the model is uncertain
- Taking the model offline if major issues are detected
Monitoring helps inform these decisions, but taking action often requires coordination across teams and systems. A clear escalation path and playbook are essential. MLOps platforms can help by automating standard mitigation actions or workflows.
Model Monitoring Frameworks
Model monitoring is a complex and multifaceted process. Luckily, a number of open-source frameworks and cloud provider tools have emerged to simplify implementing model monitoring at scale.
Popular open-source tools for model monitoring include:
-
Evidently: Evidently is an open-source Python library for data and ML model monitoring. It can integrate with any ML pipeline and provides a dashboard for analyzing data drift and model performance.
-
WhyLogs: WhyLogs is a unified statistical logging library that enables logging, monitoring, and observing ML data pipelines. It can track changes in data distributions and schema over time.
-
TensorBoard: TensorBoard is a widely-used tool for visualizing ML experiments, originally developed for TensorFlow models. Its dashboard can also monitor live model performance metrics.
-
Prometheus: Prometheus is a popular open-source monitoring system that can be used to track operational metrics for ML services, with integrations for Kubernetes and other infrastructure.
Cloud providers also offer managed services for model monitoring:
-
AWS SageMaker Model Monitor: Automatically detects concept drift by monitoring live data, comparing it to baseline data, and computing model quality metrics. Sends alerts when drift is detected.
-
Google Vertex AI Model Monitoring: Monitors models for skew and drift, integrates with Vertex Explainable AI to analyze performance across data slices, and enables setting custom alerts and policies.
-
Azure Machine Learning Model Monitoring: Collects model input data and predictions, computes model performance metrics, integrates with Azure Monitor for custom alerts, and enables taking automated actions.
The choice of model monitoring framework depends on your model development stack, deployment infrastructure, scale, and monitoring requirements. Key factors to consider include integration points, flexibility, customization, performance, and cost. It‘s worth starting simple and expanding your monitoring systems iteratively as your ML efforts mature.
Best Practices
From the collective experience of teams deploying models at scale, a set of best practices for model monitoring have emerged:
-
Define KPIs and Thresholds: Explicitly define the most important metrics for your model and set acceptable thresholds for performance, data quality, latency, etc. This provides a clear, measurable definition of model health.
-
Automate Monitoring and Alerts: Manually inspecting dashboards doesn‘t scale. Set up automated model monitoring with proactive alerts when metrics deviate from expected behavior. This enables quickly identifying and mitigating issues.
-
Document Model Behavior: Maintain thorough documentation of the expected behavior of your model, its known limitations, and how to interpret its predictions. This context is invaluable when debugging issues that arise in production.
-
Have a Mitigation Plan: Proactively develop a playbook for how to handle common model issues, such as data quality problems or unexpected performance drops. A clear mitigation plan minimizes downtime and inconsistent responses across teams.
-
Test and Validate Your Monitoring: Monitoring systems are not infallible. Regularly test your monitoring setup by manually injecting faults or replaying historical data. Chaos engineering techniques help validate your monitoring catches real problems.
-
Monitor Models End-to-End: Effective model monitoring requires visibility into every aspect of the ML system, from data ingestion to prediction serving. Focus on the overall system health, not just isolated model metrics.
-
Monitor Both Aggregate and Sliced Metrics: Track high-level aggregate metrics for the overall model, but also monitor performance across important data slices and cohorts. This helps surface issues that impact only certain groups.
-
Involve Diverse Stakeholders: Model monitoring benefits from diverse perspectives, including data scientists, ML engineers, DevOps engineers, and business stakeholders. Foster cross-functional collaboration and visibility.
Challenges at Scale
As the number and complexity of production ML models grows, model monitoring presents novel challenges:
-
Data Volume and Cardinality: Monitoring data quality and model performance requires processing massive volumes of requests and responses. High cardinality data makes tracking statistics even more resource intensive.
-
Real-time Requirements: Serving models often have tight latency constraints, making synchronous monitoring difficult. Asynchronous architectures can decouple monitoring overhead but introduce delays in issue detection.
-
Lack of Labels: Measuring live model performance is tricky when ground truth labels are not available in real time. Workarounds like a canary model or a human-in-the-loop system add cost and complexity.
-
Monitoring Costs: Detailed monitoring at scale can be expensive in terms of compute, storage, and network traffic. Careful sampling and setting appropriate monitoring granularity helps manage costs.
-
Noisy Metrics: With a large number of models and metrics, separating the signal from the noise is difficult. More advanced anomaly detection and correlation analysis techniques may be needed.
-
Compliance and Privacy: Monitoring live models may involve processing sensitive user data, which requires robust security practices and compliance with regulations like GDPR and HIPAA.
-
Explainability and Fairness: Monitoring overall model performance is not enough. Teams must also track model explanations and fairness metrics, which often requires special tooling and expertise.
Tackling these challenges requires thoughtful monitoring architectures, automation to scale human oversight, and collaboration across data science, engineering, and other functions. As the MLOps ecosystem matures, we expect to see more standardization and tooling to streamline monitoring at scale.
Conclusion
Model deployment and monitoring are critical components of the MLOps lifecycle. Deployment is not a one-time event, but an ongoing process of releasing and iterating models. Monitoring is the key to maintaining the health and performance of models over time in production.
Effective monitoring requires tracking data quality, model performance, model fairness, operational metrics, and business impact. Automating the collection and analysis of monitoring data with appropriate thresholds and alerts is a must for catching issues quickly. Taking the right corrective actions in a timely manner completes the model monitoring loop.
A variety of open-source frameworks and commercial tools are available to build model monitoring solutions for different scales and environments. Investing in a robust model monitoring foundation pays long-term dividends in model reliability and maintainability.
As ML models proliferate and the stakes rise, model monitoring will only become more critical. It‘s an essential capability for organizations adopting MLOps to deliver and sustain impact from their ML initiatives. Embrace model monitoring from the start and your models will thank you!