Plotting Images in Python with Matplotlib: The Ultimate Guide
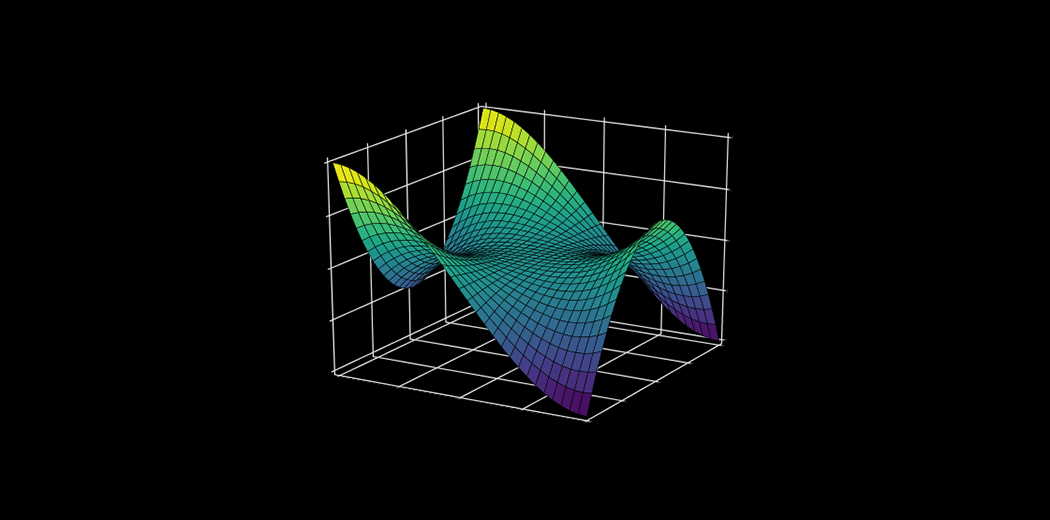
Matplotlib is one of the most popular and powerful plotting libraries available in Python. While it is best known for creating 2D charts and graphs, Matplotlib also has robust support for working with image data.
In this ultimate guide, we‘ll take an in-depth look at how to use Matplotlib to plot, manipulate, and save images in Python. Whether you‘re a data scientist, computer vision engineer, or hobbyist, by the end of this article you‘ll be equipped with the knowledge and code samples you need to masterfully plot images with Matplotlib. Let‘s dive in!
Importing Matplotlib and Reading Images
The first step is to import the required Matplotlib modules and read the image file into a NumPy array that we can work with. We‘ll use the pyplot module for plotting and the image submodule for loading image data:
import matplotlib.pyplot as plt
import matplotlib.image as mpimg
img = mpimg.imread(‘example.jpg‘)
The imread() function takes the filename of the image and returns it as a NumPy array. Matplotlib supports many common image formats like PNG, JPG, BMP, and GIF.
If the image is in the same directory as your Python script you can just specify the filename. Otherwise, provide the full path. Matplotlib will automatically detect the image format based on the file extension.
Displaying Images with imshow()
Now that we have the image loaded into a NumPy array, we can display it using Matplotlib‘s imshow() function:
plt.imshow(img)
plt.show()
This will render the image in a new window. The imshow() function takes the NumPy image array as its main argument and has several optional parameters for customizing the display.
By default, imshow() will fit the entire image within the plotting area. If you want to display the image at its native resolution, set the aspect parameter to ‘equal‘:
plt.imshow(img, aspect=‘equal‘)
Selecting Parts of an Image
Sometimes you may want to plot only a specific section or region of an image. With Matplotlib this is easy to do by slicing the NumPy array.
For example, to select just the middle square portion of the image:
cropped_img = img[100:400, 200:500] plt.imshow(cropped_img)
This uses standard NumPy array slicing to extract the rectangular region of the image with a top-left coordinate of (100, 200) and a bottom-right of (400, 500).
You can use this technique to zoom in on an area of interest in the image or extract specific objects.
Adding Colorbars and Axes
A color bar is a helpful addition to visualize the range and distribution of pixel intensities in the image. To add one, just call the colorbar() function:
plt.imshow(img)
plt.colorbar()
This will show the color bar to the right of the image. By default it will fit the height of the image, but you can control its size and positioning.
The numerical axes around the image can also be customized. Major and minor ticks can be added:
plt.xticks(range(0, img.shape[1], 200))
plt.yticks(range(0, img.shape[0], 200))
This will place tick marks every 200 pixels in the X and Y dimensions respectively.
To remove the axes completely:
plt.axis(‘off‘)
Converting to Grayscale
Color images can be converted to black and white by extracting a single channel of the image data. For RGB images, we can take the red, green or blue channel:
red_channel = img[:,:,0] plt.imshow(red_channel, cmap=‘gray‘)
This takes just the first channel which corresponds to red. The green and blue channels are at indexes 1 and 2.
Setting the cmap to ‘gray‘ tells Matplotlib to display the single channel image in grayscale.
Saving Modified Images
After manipulating an image or creating a new plot, you can easily save it to a file with the savefig() function:
plt.savefig(‘modified_image.png‘)
This will save the current figure to a PNG file in the same directory as the script. You can change the output format by specifying a different file extension.
Matplotlib supports saving images at very high resolutions that are suitable for print reproduction. Simply set the dpi parameter to control the output resolution in dots per inch:
plt.savefig(‘high_res_image.png‘, dpi=300)
Image Histograms
Histograms are frequently used in image processing to visualize the distribution of pixel intensities. Matplotlib has a hist() function that makes it easy to plot a histogram from image data:
plt.hist(img.ravel(), bins=256, range=(0,1))
The ravel() method flattens the image array into a 1D list of pixel values that the hist() function expects as input.
Setting bins to 256 will create a separate histogram bar for each possible 8-bit grayscale value. The range parameter limits the pixel values to the standard grayscale range between 0 and 1.
Examining an image‘s histogram can be useful for adjusting brightness and contrast, or finding a threshold value for separating foreground from background pixels.
Alternatives to Matplotlib
While Matplotlib is a very capable library for plotting image data, it‘s not the only option. Two other popular choices are:
OpenCV: A powerful computer vision library that also has utilities for loading, displaying and saving images. OpenCV uses NumPy arrays for image data just like Matplotlib.
Pillow: A more lightweight image manipulation library. It has a simple interface for reading and writing image files as well as doing basic transformations like resizing and rotating.
So when should you use Matplotlib over these other options? Some reasons are:
- You‘re already doing data analysis or plotting with Matplotlib and want to keep things consistent
- You need very fine control over the plot styling and customization
- You‘re working in an interactive Python environment like Jupyter notebooks
Matplotlib‘s ability to integrate with the rest of its plotting ecosystem is a key advantage. You can seamlessly combine image plots with graphs, charts and other visualizations.
Advanced Image Plotting Techniques
Once you‘ve mastered the basics of plotting images with Matplotlib, here are some more advanced techniques to try:
Alpha blending: Overlay two images with transparency by setting the alpha parameter of imshow()
plt.imshow(img1)
plt.imshow(img2, alpha=0.5)
This will plot img1 at full opacity and img2 blended on top at 50% opacity. You can use this for image watermarking or visual comparisons.
Animating images: Create videos or animated GIFs from a sequence of images using Matplotlib‘s animation module. This lets you visualize how an image changes over time.
Displaying multiple images: Plot a grid of image thumbnails by using add_subplot() to create a matrix of axes. This is useful for visualizing the steps of an image processing pipeline or showing examples from an image dataset.
With a little creativity, the sky‘s the limit for the types of image visualizations you can create using Python and Matplotlib.
Conclusion
Matplotlib is a versatile tool for plotting image data in Python. With a few lines of code you can load, transform and visualize images in nearly any format. The ability to fine tune and customize every aspect of the plots gives you complete control over the end result.
Remember that image plotting is just one capability of Matplotlib. You can leverage the rest of its functionality to create publication-quality figures that combine photos, graphs, text and more. Treat Matplotlib as a Swiss Army knife in your data visualization toolbox.
By following the techniques and best practices covered in this guide, you‘ll be able to create informative and visually appealing plots that bring out the most important details in your image data. Get out there and start visualizing!
All code examples in this article were tested with Matplotlib 3.5.2 and Python 3.9. Images shown are from Wikipedia under a Creative Commons license. Consult the official Matplotlib documentation for the most up-to-date information and examples.