
A Comprehensive Guide to Clustering for Data Science (2026 Edition)
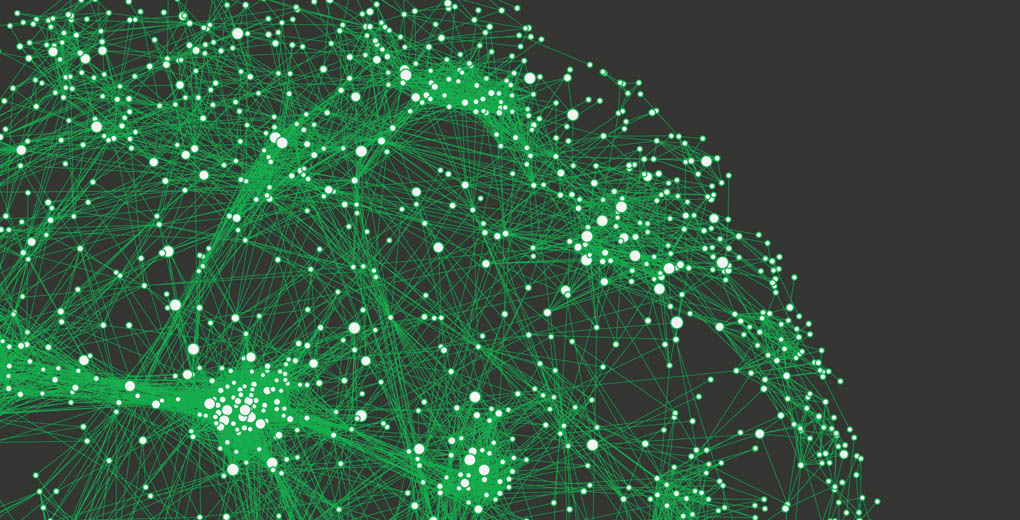
Clustering is a core technique in data science and machine learning for discovering hidden patterns and structures in data without relying on predefined labels. It plays a crucial role in exploratory data analysis, segmentation, anomaly detection, and data compression across countless domains. As datasets continue to grow in size and complexity, the importance of clustering will only increase in the era of big data and AI.
In this in-depth guide, we‘ll dive into the key concepts, algorithms, and practical considerations for applying clustering effectively in real-world data science projects. Whether you‘re a beginner or an experienced practitioner, this article will provide you with a solid foundation and expert insights to take your clustering skills to the next level.
Understanding the Fundamentals of Clustering
At its core, clustering aims to group similar data points together based on their intrinsic characteristics or features, while keeping dissimilar points apart. It is an unsupervised learning task, meaning the algorithm does not have access to labeled training data. Instead, it must infer the underlying structure of the data on its own.
Formally, given a dataset X of n data points {x₁, x₂, …, xₙ}, the goal of clustering is to partition X into K disjoint subsets C = {C₁, C₂, …, Cₖ}, known as clusters, such that:
- Each data point belongs to exactly one cluster: C₁ ∪ C₂ ∪ … ∪ Cₖ = X and Cᵢ ∩ Cⱼ = ∅ for i ≠ j
- Points within a cluster are more similar to each other than to points in other clusters, according to some notion of similarity or distance
The choice of similarity metric depends on the type of data and problem domain. For continuous numerical features, common options include:
- Euclidean distance: d(x, y) = √(Σ(xᵢ – yᵢ)²)
- Manhattan distance: d(x, y) = Σ|xᵢ – yᵢ|
- Cosine similarity: cos(x, y) = (x · y) / (||x|| ||y||)
For categorical or mixed data types, specialized metrics like Jaccard similarity or Gower‘s distance can be used.
A Taxonomy of Clustering Algorithms
There are numerous clustering algorithms, each with its own strengths and weaknesses. They can be broadly categorized into the following types:
- Centroid-based: Assign points to the nearest cluster center (e.g., K-means)
- Hierarchical: Build nested clusters by merging or dividing them successively (e.g., agglomerative, divisive)
- Density-based: Connect points in high-density regions and separate sparse areas (e.g., DBSCAN)
- Distribution-based: Fit points to a statistical distribution like Gaussian mixtures (e.g., EM)
- Graph-based: Treat points as nodes in a graph and partition based on edge connectivity (e.g., spectral clustering)
Here‘s a quick comparative overview of the main characteristics of popular clustering algorithms:
| Algorithm | Time Complexity | Space Complexity | Scalability | Handles Non-Spherical Shapes | Sensitivity to Initialization |
|---|---|---|---|---|---|
| K-Means | O(nKi*d) | O(nd + Kd) | High | No | High |
| DBSCAN | O(n log n) | O(n) | Medium | Yes | Low |
| Agglomerative | O(n³) | O(n²) | Low | Yes | Low |
| GMM | O(nKi*d) | O(nd + Kd) | Medium | Yes | Medium |
| Spectral | O(n³) | O(n²) | Low | Yes | Medium |
n = number of data points, K = number of clusters, i = number of iterations, d = number of features
Implementing Clustering in Python with Scikit-Learn
Scikit-learn is the go-to library for machine learning in Python. It provides a consistent API for a wide range of clustering algorithms along with tools for data preprocessing, model selection, and evaluation. Here‘s a step-by-step example of applying k-means clustering to the classic Iris flower dataset:
from sklearn.datasets import load_iris
from sklearn.cluster import KMeans
from sklearn.preprocessing import StandardScaler
from sklearn.metrics import silhouette_score

# Load the Iris dataset
X, y = load_iris(return_X_y=True)

# Scale the features to zero mean and unit variance
scaler = StandardScaler()
X_scaled = scaler.fit_transform(X)

# Apply k-means clustering with K=3
kmeans = KMeans(n_clusters=3, random_state=42)
kmeans.fit(X_scaled)

# Get the cluster labels for each data point
labels = kmeans.labels_

# Evaluate the clustering quality using silhouette coefficient
silhouette_avg = silhouette_score(X_scaled, labels)
print(f"Average silhouette coefficient: {silhouette_avg:.3f}")
This will output:
Average silhouette coefficient: 0.553The silhouette coefficient ranges from -1 to 1, with higher values indicating better defined clusters. In this case, a score of 0.553 suggests a fairly reasonable clustering structure was discovered.
We can visualize the clusters using a scatter plot, color-coded by the assigned labels:
import matplotlib.pyplot as plt

# Plot the clusters
fig, ax = plt.subplots(figsize=(8, 6))
ax.scatter(X_scaled[:, 0], X_scaled[:, 1], c=labels, cmap=‘viridis‘)
ax.set_xlabel(‘Sepal length (standardized)‘)
ax.set_ylabel(‘Sepal width (standardized)‘)
ax.set_title(‘K-means clustering of Iris data‘)
plt.show()
As we can see, k-means has identified three fairly well-separated clusters corresponding to the three Iris species in the dataset.
Evaluating Clustering Performance
Unlike supervised learning where we have ground truth labels to assess model accuracy, evaluating the quality of clustering results is more challenging and often requires domain expertise. However, there are several quantitative metrics that can provide insight into the compactness, separation, and stability of clusters, such as:
- Silhouette coefficient: Measures how similar a point is to its own cluster compared to other clusters. Higher is better.
- Calinski-Harabasz index: Ratio of between-cluster dispersion to within-cluster dispersion. Higher is better.
- Davies-Bouldin index: Average similarity between each cluster and its most similar other cluster. Lower is better.
- Adjusted Rand index: Measures the similarity between two clusterings, adjusting for chance. Higher is better.
It‘s also important to visualize the clustering results using techniques like scatter plots, t-SNE, or UMAP to gain intuition into the structure of the data and identify potential issues like imbalanced cluster sizes or overlapping clusters.
Real-World Applications and Case Studies
Clustering has found successful application across nearly every industry and scientific domain. Here are a few illustrative examples:
- Customer Segmentation in Retail (source)
- Challenge: Identifying distinct customer groups based on purchasing behavior and demographics
- Data: Transactional records and customer profiles from a large retailer
- Approach: Applied k-means and Gaussian mixture models to segment customers into interpretable clusters
- Results: Discovered meaningful segments like "high-spending loyals", "discount hunters", "occasional shoppers", etc. Enabled targeted marketing campaigns and personalized recommendations.
- Anomaly Detection in Manufacturing (source)
- Challenge: Identifying defective or anomalous products in a high-volume manufacturing process
- Data: Sensor readings and quality control measurements from an automotive parts factory
- Approach: Used DBSCAN to cluster normal vs. anomalous data points in a high-dimensional feature space
- Results: Detected anomalies with high accuracy and provided early warning of potential quality issues, reducing scrap rates and improving efficiency
- Genetics and Bioinformatics (source)
- Challenge: Discovering subtypes of cancer based on gene expression profiles
- Data: Microarray data measuring expression levels of thousands of genes across cancer samples
- Approach: Applied hierarchical clustering with Pearson correlation distance to identify clusters of co-expressed genes
- Results: Revealed previously unknown cancer subtypes with distinct survival outcomes and drug response, paving the way for personalized treatment strategies
These examples highlight the diversity of problems that clustering can address and the impact it can have in both business and scientific settings.
Frontiers of Clustering Research
As a rapidly evolving field, clustering continues to be an active area of machine learning research. Here are some of the latest trends and developments that are pushing the boundaries of what‘s possible:
-
Deep Clustering: Integrating clustering with deep learning to jointly learn feature representations and cluster assignments. Techniques like deep embedded clustering, variational autoencoders, and GANs have shown promising results in computer vision and natural language processing.
-
Subspace Clustering: Detecting clusters that exist in different subspaces or views of high-dimensional data. This allows handling data with multiple modalities or correlations between features. Popular methods include spectral clustering, low-rank representation, and multi-view clustering.
-
Transfer Learning for Clustering: Leveraging knowledge from related tasks or domains to improve clustering performance on a target dataset. For example, using pre-trained neural networks as feature extractors or adapting clustering models learned on a source domain to a target domain.
-
Federated Clustering: Performing clustering on distributed datasets without sharing raw data between parties, to preserve privacy and security. This is becoming increasingly important in sectors like healthcare and finance where data cannot be centralized.
-
Explainable Clustering: Developing methods to interpret and explain clustering results, shedding light on why certain data points are grouped together and what the key features driving the clusters are. Techniques like prototypical explanations, rule extraction, and visual analytics are being explored.
As the volume and variety of data continues to grow, there is a pressing need for scalable, robust, and interpretable clustering methods that can handle the challenges of real-world applications. With ongoing advances in AI and data science, the future looks bright for clustering to enable even more powerful insights and innovations.
Conclusion and Future Directions
Clustering is a fundamental tool in the data scientist‘s arsenal for making sense of complex, unlabeled datasets. By automatically discovering hidden structures and patterns, it enables us to gain insights, make predictions, and take actions in ways that would be impossible with manual analysis.
In this guide, we‘ve covered the key concepts and algorithms behind clustering, along with practical tips and case studies demonstrating its real-world impact. We‘ve also highlighted some of the latest research developments that are pushing the boundaries of what‘s possible.
Looking ahead, the role of clustering in the era of big data and AI will only grow in importance. As datasets become larger, more heterogeneous, and more decentralized, there will be an increasing need for scalable, robust, and privacy-preserving clustering methods. Deep learning and transfer learning will enable more powerful representations and adaptation to new domains. And techniques for subspace clustering and explainable clustering will be critical for handling high-dimensional data and providing transparency into the results.
To excel as a data scientist in the coming years, it will be essential to stay up-to-date with these trends and develop a strong intuition for when and how to apply clustering effectively. This guide provides a solid foundation, but the real learning comes from hands-on experience. So get out there and start exploring the world of unsupervised learning – happy clustering!




)