Spectral Clustering: What, Why, and How
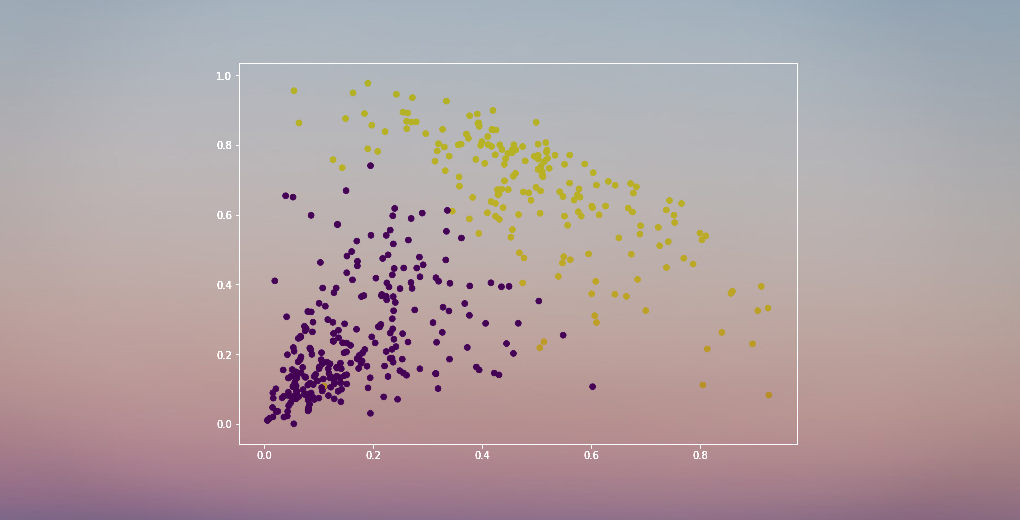
Clustering is a fundamental task in machine learning and data analysis that involves dividing a dataset into groups, or clusters, of similar data points. While there are many different clustering algorithms available, spectral clustering has emerged as a powerful technique that offers several advantages over traditional methods. In this article, we‘ll take an in-depth look at what spectral clustering is, why you might want to use it, and how it works under the hood.
What is Spectral Clustering?
At its core, spectral clustering is a graph-based clustering algorithm that treats the data as a graph, where the data points are nodes and the edges represent the similarity between points. The goal is to partition this graph such that points in the same cluster are highly connected, while points in different clusters are weakly connected.
Unlike clustering algorithms that rely solely on the spatial positions of the data points, such as k-means, spectral clustering considers the connectivity and structure of the data. This allows it to discover clusters with non-convex boundaries and arbitrary shapes.
The key idea behind spectral clustering is to leverage the spectrum, or set of eigenvalues, of the graph Laplacian matrix to map the data into a lower-dimensional space where clusters are more apparent. By working in this reduced space, spectral clustering is able to uncover complex cluster structures that may not be visible in the original feature space.
Why Use Spectral Clustering?
There are several compelling reasons to choose spectral clustering over other clustering algorithms:
-
Handles arbitrary shaped clusters: Spectral clustering excels at finding clusters that are not necessarily convex or spherical. It can uncover clusters with complex, intertwined shapes that would be difficult for methods like k-means.
-
Captures connectivity of data: By considering the similarity graph, spectral clustering accounts for the relationships and connections between data points. This is particularly useful when the clusters are separated by regions of low density rather than clear gaps.
-
Provides a global view: Spectral clustering takes into account the global structure of the data by examining the eigenvalues and eigenvectors of the graph Laplacian. This allows it to make more informed clustering decisions compared to local methods.
-
Flexible similarity measures: The similarity graph can be constructed using various similarity or distance measures, providing flexibility to adapt to different data types and domains.
Of course, spectral clustering also has some tradeoffs to consider. It can be computationally expensive for large datasets due to the need to construct the similarity graph and perform eigen-decomposition. Additionally, the results can be sensitive to the choice of parameters, such as the width of the Gaussian kernel used to compute similarities.
Spectral Clustering Algorithm
Now that we understand the motivation behind spectral clustering, let‘s dive into the steps involved in the algorithm:
-
Construct the similarity graph: The first step is to build a graph representation of the data, where nodes correspond to data points and edges represent the similarity between them. Common choices for computing similarities include the Gaussian kernel or the k-nearest neighbors approach.
-
Compute the graph Laplacian: From the similarity graph, we construct the graph Laplacian matrix. The unnormalized Laplacian is defined as L = D – W, where W is the adjacency matrix of the similarity graph and D is a diagonal matrix with entries equal to the row sums of W.
-
Eigen-decomposition of Laplacian: We compute the eigenvalues and eigenvectors of the Laplacian matrix L. The eigenvectors corresponding to the smallest eigenvalues (excluding the trivial eigenvalue of 0) provide a lower-dimensional representation of the data that enhances the cluster structure.
-
Cluster in reduced space: Finally, we perform clustering on the reduced-dimensional representation obtained from the eigenvectors. A common choice is to use k-means clustering, treating each row of the eigenvector matrix as a point in a k-dimensional space.
By following these steps, spectral clustering maps the original data into a space where clusters are more compact and separable, making the clustering task easier.
Applications of Spectral Clustering
Spectral clustering finds applications across various domains, including:
-
Image segmentation: Spectral clustering can be used to partition an image into meaningful segments based on pixel similarity, enabling tasks such as object detection and background separation.
-
Community detection in networks: In social network analysis, spectral clustering helps identify communities or groups of densely connected individuals.
-
Spam detection: By constructing a similarity graph based on email content and sender/recipient relationships, spectral clustering can aid in detecting spam email clusters.
-
Customer segmentation: Spectral clustering can be applied to group customers based on their purchasing behavior, demographic information, or other relevant features.
These are just a few examples, but spectral clustering‘s versatility makes it applicable to a wide range of problems where discovering underlying structure and groups in data is valuable.
Implementing Spectral Clustering in Python
Let‘s see how we can easily implement spectral clustering using the scikit-learn library in Python. Here‘s a simple example:
from sklearn.cluster import SpectralClustering
from sklearn.datasets import make_moons

# Generate a sample dataset with two intertwined moons
X, _ = make_moons(n_samples=200, noise=0.05, random_state=42)

# Apply spectral clustering
clustering = SpectralClustering(n_clusters=2, affinity=‘nearest_neighbors‘, random_state=42).fit(X)
labels = clustering.labels_

# Plot the results
import matplotlib.pyplot as plt
plt.scatter(X[:, 0], X[:, 1], c=labels, cmap=‘viridis‘)
plt.title(‘Spectral Clustering‘)
plt.show()
In this example, we generate a sample dataset consisting of two intertwined moons using the make_moons function from scikit-learn. We then create a SpectralClustering object, specifying the desired number of clusters (n_clusters) and the affinity matrix construction method (affinity). Calling fit on the object performs the spectral clustering and assigns cluster labels to each data point.
Finally, we visualize the resulting clusters using a scatter plot, where points are colored according to their assigned cluster label. The output plot clearly shows the two moons separated into distinct clusters.
Conclusion
Spectral clustering is a powerful and versatile clustering algorithm that leverages the graph structure of the data to uncover complex cluster shapes and connectivity patterns. By considering the eigenvalues and eigenvectors of the graph Laplacian, spectral clustering maps the data into a lower-dimensional space where clusters are more separable.
While spectral clustering offers several advantages, such as handling non-convex clusters and capturing data connectivity, it‘s important to keep in mind its computational complexity and sensitivity to parameter choices. Understanding the tradeoffs and carefully tuning the algorithm is crucial for obtaining meaningful results.
Python libraries like scikit-learn make it straightforward to implement spectral clustering, allowing practitioners to easily apply this technique to a variety of real-world problems.
If you‘re interested in learning more about spectral clustering and its theoretical foundations, I recommend exploring further resources such as research papers and textbooks on graph-based clustering and spectral graph theory.
Spectral clustering is a valuable tool in the machine learning practitioner‘s toolkit, offering a fresh perspective on the clustering problem and enabling the discovery of intricate patterns in data. By understanding its strengths and limitations, you can effectively harness the power of spectral clustering to gain insights and make data-driven decisions.