
A Comprehensive Guide to Becoming a Data Analyst in 2026
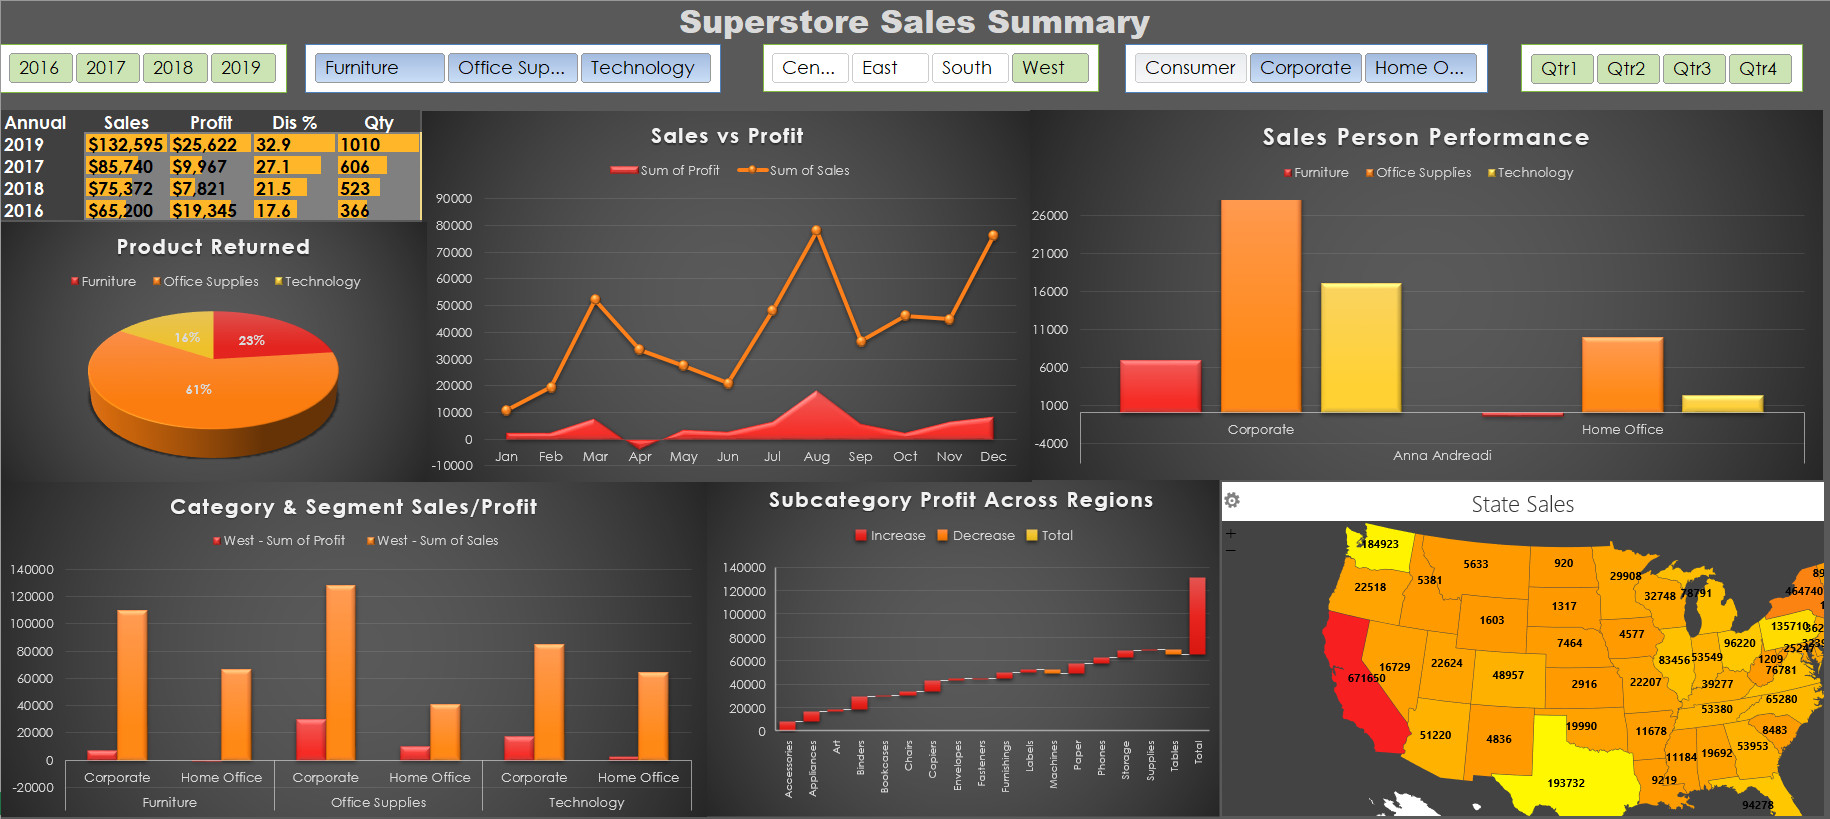
In today‘s data-driven world, organizations across industries are seeking to harness the power of data to make better decisions, improve operations, and gain a competitive edge. As a result, the demand for skilled data analysts continues to grow. According to the U.S. Bureau of Labor Statistics, employment of data analysts is projected to grow 23% from 2021 to 2031, much faster than the average for all occupations[^1].
If you‘re analytically-minded, enjoy solving problems with data, and are considering a career in this high-growth field, this guide will walk you through the key skills, tools, and strategies you‘ll need to succeed as a data analyst in 2024 and beyond.
The Core Technical Skills of a Data Analyst
1. Programming Languages
Proficiency in statistical programming languages is a core requirement for data analysts. The most commonly used languages in the field are:
Python: Python has become the go-to language for data analysis due to its versatility, extensive libraries, and ease of use. Some key Python libraries for data analysts include:
- NumPy: for numerical computing
- Pandas: for data manipulation and analysis
- Matplotlib and Seaborn: for data visualization
- Scikit-learn: for machine learning
R: R is widely used for statistical computing and provides a rich ecosystem of packages for data analysis, such as dplyr for data manipulation and ggplot2 for creating visualizations.
SQL: SQL (Structured Query Language) is essential for working with relational databases to extract, filter, and aggregate data. Variants like PostgreSQL, MySQL, and Microsoft SQL Server are commonly used in enterprises.
While expertise in all three languages is ideal, focusing on building strong skills in one language (e.g., Python) while gaining a working knowledge of the others is a pragmatic approach.
2. Data Preprocessing and Exploration
Raw data is often messy and requires preprocessing before it can be analyzed. Data analysts need to be skilled in data cleaning, handling missing values, and transforming data into suitable formats. Exploratory data analysis (EDA) techniques are used to summarize the main characteristics of a dataset and uncover patterns, trends, and relationships. Key EDA techniques include:
- Univariate analysis: understanding the distribution of individual variables
- Bivariate analysis: exploring relationships between pairs of variables
- Multivariate analysis: understanding interactions between multiple variables
Data visualization plays a crucial role in EDA, allowing analysts to communicate insights effectively. Popular data visualization libraries in Python include Matplotlib and Seaborn, while ggplot2 is widely used in R.
3. Statistical Analysis and Machine Learning
A strong foundation in statistics is essential for data analysts to draw valid conclusions from data. Some key statistical concepts and techniques include:
- Descriptive statistics (mean, median, mode, standard deviation)
- Probability distributions
- Hypothesis testing and p-values
- Correlation and regression analysis
- Sampling and experimental design
Machine learning is increasingly used by data analysts to build predictive models and uncover patterns in data. While building complex models is typically the domain of data scientists, analysts should be familiar with common machine learning algorithms such as:
- Linear regression
- Logistic regression
- Decision trees and random forests
- K-means clustering
Familiarity with machine learning workflows, feature engineering, and model evaluation metrics is valuable for data analysts.
4. Data Visualization and Storytelling
Creating compelling visualizations and communicating insights through data storytelling are essential skills for data analysts. Effective data storytelling involves weaving a narrative around the data, highlighting key insights, and making recommendations based on the findings.
Some popular tools used for data visualization and dashboarding include:
Tableau: Tableau is a widely used business intelligence and data visualization tool that allows users to create interactive dashboards and charts without coding.
Power BI: Microsoft Power BI is a collection of services and apps that enable users to visualize data from various sources, create reports, and share insights across an organization.
Excel: While Excel is sometimes overlooked in favor of more advanced tools, it remains widely used for data analysis and visualization, especially in smaller organizations.
Building a portfolio of projects that showcase your ability to turn data into insights and communicate findings effectively is valuable when seeking data analyst roles.
The Changing Landscape of Data Analytics
The Impact of Artificial Intelligence and Machine Learning
Artificial intelligence (AI) and machine learning (ML) are transforming many aspects of data analytics. As AI and ML tools become more accessible and easier to use, data analysts are increasingly expected to leverage these technologies in their work.
Some ways AI and ML are changing the data analyst role include:
- Automated data preprocessing and feature engineering
- Augmented analytics, where AI/ML assists in identifying patterns and generating insights
- Predictive analytics and forecasting using ML models
- Natural language processing (NLP) for analyzing unstructured text data
- Anomaly detection and alert systems powered by ML
To stay competitive, data analysts should seek to build skills in AI/ML techniques and tools. This may involve learning libraries like TensorFlow or PyTorch, building familiarity with cloud-based AI services, or developing skills in data engineering to support ML workflows.
The Emergence of the Analytics Translator Role
As organizations seek to become more data-driven, there is a growing need for professionals who can bridge the gap between the technical world of data and the business world. McKinsey & Company has identified the emergence of the "Analytics Translator" role, which combines data analytics skills with business acumen and communication skills[^2].
Analytics Translators work closely with business leaders to identify opportunities for leveraging data and analytics, translate business needs into data questions, and communicate insights back to stakeholders in a clear and actionable way. This role requires a blend of technical, business, and soft skills.
Some key skills for Analytics Translators include:
- Strong business acumen and understanding of the domain
- Ability to identify high-impact use cases for analytics
- Collaborative problem-solving with cross-functional teams
- Translating technical concepts for non-technical audiences
- Influencing and driving change based on data-driven insights
As the Analytics Translator role grows in prominence, it presents an exciting career path for data analysts looking to increase their impact and move into more strategic positions.
Building Your Skills and Landing a Data Analyst Job
Developing a Learning Plan
With the vast amount of resources available online, it can be overwhelming to know where to start when building data analytics skills. Creating a structured learning plan can help you stay focused and make steady progress.
Some key areas to include in your learning plan:
- Programming languages (Python, R, SQL)
- Statistics and machine learning concepts
- Data preprocessing and visualization techniques
- Relevant libraries and tools (Pandas, Scikit-learn, Tableau, etc.)
- Domain knowledge in your target industry
Set achievable goals, create a timeline, and track your progress. Engage in hands-on practice through projects and coding exercises to reinforce your learning.
Gaining Practical Experience
Hands-on experience is crucial for aspiring data analysts. Participating in data projects, internships, or volunteering your skills can help you build a portfolio and demonstrate your abilities to potential employers.
Some ways to gain practical experience include:
- Analyzing public datasets from sources like Kaggle, data.world, or government open data portals
- Contributing to open-source data projects on GitHub
- Participating in data hackathons or competitions
- Seeking internships or part-time roles in data analytics
- Freelancing or volunteering your data skills for small businesses or non-profits
As you complete projects, document your work and create write-ups or presentations that showcase your process, insights, and impact. Share your projects on platforms like GitHub, Kaggle, or a personal blog to build your online presence.
Landing a Data Analyst Job
When applying for data analyst roles, tailor your resume and portfolio to highlight your relevant skills and experiences. Some tips for standing out:
- Emphasize your technical skills (programming languages, tools, statistical techniques)
- Showcase 2-3 impactful projects that demonstrate your end-to-end problem-solving abilities
- Highlight your communication and collaboration skills through examples
- Customize your application to the specific role and company
- Seek referrals and network within the data community
Consider acquiring certifications from reputable providers like Microsoft, Tableau, or IBM to validate your skills. However, practical experience and projects are often more important than certifications alone.
Data Analyst Salary and Job Outlook
According to Glassdoor, the national average salary for a Data Analyst in the United States is $69,517 per year, with salaries ranging from $51,000 to $95,000 depending on factors like location, industry, and experience level[^3]. Senior Data Analysts can earn upwards of $100,000 per year.
The Robert Half Technology Salary Guide provides a detailed breakdown of data analyst salaries by percentile and location[^4]:
| Percentile | 25th | 50th | 75th | 95th |
|---|---|---|---|---|
| Salary | $61,250 | $78,000 | $97,500 | $123,500 |
Data analyst salaries in the United States (Source: Robert Half Technology Salary Guide 2021)
In terms of job outlook, the demand for data analysts is expected to remain strong. IBM predicts that the number of data-related jobs in the U.S. will increase by 364,000 to 2,720,000 by 2024[^5]. Data analyst roles are found across industries, with particularly high demand in sectors like finance, healthcare, technology, and consulting.
Conclusion
Becoming a data analyst requires a combination of technical skills, business acumen, and communication abilities. By focusing on building skills in programming, statistics, data preprocessing, visualization, and machine learning, you can position yourself for success in this high-growth field.
As the field of data analytics continues to evolve, with the increasing adoption of artificial intelligence and machine learning, it‘s important to stay adaptable and commit to continuous learning. Seeking out practical experience through projects, internships, and volunteering can help you build a compelling portfolio and stand out to employers.
With strong demand and competitive salaries, a career as a data analyst offers opportunities for growth and impact across industries. By following the strategies outlined in this guide and staying persistent in your skill development, you can launch a rewarding career in data analytics.
[^1]: U.S. Bureau of Labor Statistics. (2022). Occupational Outlook Handbook: Data Analysts. Retrieved from https://www.bls.gov/ooh/computer-and-information-technology/data-analysts.htm [^2]: Henke, N., Levine, J., & McInerney, P. (2018). You Don‘t Have to Be a Data Scientist to Fill This Must-Have Analytics Role. Harvard Business Review. Retrieved from https://hbr.org/2018/02/you-dont-have-to-be-a-data-scientist-to-fill-this-must-have-analytics-role [^3]: Glassdoor. (2023). Data Analyst Salaries. Retrieved from https://www.glassdoor.com/Salaries/data-analyst-salary-SRCH_KO0,12.htm [^4]: Robert Half. (2021). 2021 Technology Salary Guide. Retrieved from https://www.roberthalf.com/salary-guide/technology [^5]: Burning Glass Technologies. (2021). The Quant Crunch: Demand for Data Science Skills. Retrieved from https://www.burning-glass.com/research-project/quant-crunch-2020/


![Is the iGirl AI App Safe? [2026]](https://33rdsquare.com/wp-content/uploads/2024/03/20240312063157-65eff6dd244c0.png.webp)

