A Beginner‘s Guide to Hierarchical Clustering in Python
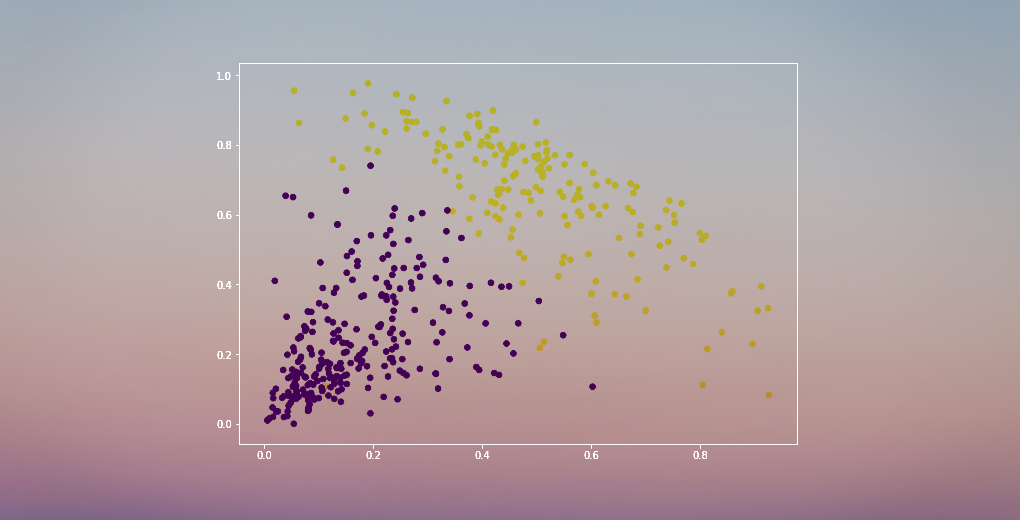
Clustering is an essential technique in data science and machine learning that involves grouping similar data points together based on their inherent characteristics or features. It is an unsupervised learning method, meaning it does not require labeled data or a predefined target variable. Clustering has a wide range of applications, including customer segmentation, anomaly detection, recommendation systems, and image segmentation, among others.
Hierarchical clustering is a popular clustering algorithm that creates a hierarchy of clusters by either merging smaller clusters into larger ones (agglomerative approach) or dividing larger clusters into smaller ones (divisive approach). In this beginner‘s guide, we will focus on agglomerative hierarchical clustering and its implementation in Python.
Understanding Hierarchical Clustering
Hierarchical clustering algorithms create a tree-like structure called a dendrogram, which represents the hierarchy of clusters. Each leaf in the dendrogram corresponds to an individual data point, and the height of the branches indicates the distance or dissimilarity between clusters.
There are two main approaches to hierarchical clustering:
- Agglomerative (bottom-up): This approach starts with each data point as a separate cluster and iteratively merges the closest clusters until all points belong to a single cluster.
- Divisive (top-down): This approach starts with all data points in a single cluster and recursively divides the cluster into smaller clusters until each point is in its own cluster.
Agglomerative hierarchical clustering is more commonly used in practice due to its computational efficiency and ease of implementation. Let‘s dive into the steps involved in agglomerative hierarchical clustering.
Steps of Agglomerative Hierarchical Clustering
- Initialize: Start with each data point as a separate cluster.
- Calculate distances: Compute the pairwise distances between all clusters using a chosen distance metric (e.g., Euclidean distance, Manhattan distance, cosine similarity).
- Merge closest clusters: Find the two clusters with the smallest distance and merge them into a single cluster.
- Update distances: Recalculate the distances between the newly formed cluster and the remaining clusters using a linkage method.
- Repeat: Repeat steps 3 and 4 until all data points belong to a single cluster.
The choice of distance metric and linkage method significantly affects the resulting cluster hierarchy. Some common linkage methods include:
- Single linkage: Measures the minimum distance between any two points in different clusters.
- Complete linkage: Measures the maximum distance between any two points in different clusters.
- Average linkage: Measures the average distance between all pairs of points in different clusters.
- Ward‘s method: Minimizes the variance of distances within clusters.
Interpreting Dendrograms
A dendrogram is a visual representation of the hierarchical clustering process. It shows the order in which clusters are merged and the distances at which merges occur. To interpret a dendrogram:
- The vertical axis represents the distance or dissimilarity between clusters.
- Each horizontal line corresponds to a merge between two clusters.
- The height of the horizontal line indicates the distance at which the merge occurs.
- Clusters that are merged at a lower height are more similar than those merged at a higher height.
By cutting the dendrogram at a certain height (distance threshold), you can obtain a specific number of clusters. This leads us to the question of how to choose the optimal number of clusters.
Choosing the Number of Clusters
Determining the optimal number of clusters is often a subjective decision and depends on the specific problem and domain knowledge. However, there are some techniques that can help guide this decision:
- Elbow method: Plot the within-cluster sum of squared distances (WSS) against the number of clusters. Look for an "elbow" point where the rate of decrease in WSS slows down significantly. This point suggests a good number of clusters.
- Silhouette analysis: Calculate the silhouette coefficient for each data point, which measures how well it fits into its assigned cluster compared to other clusters. Choose the number of clusters that maximizes the average silhouette coefficient.
- Gap statistic: Compare the WSS of the clustered data to the expected WSS under a null reference distribution. Choose the number of clusters that maximizes the gap between the observed and expected WSS.
It‘s important to note that these methods provide guidelines, and the final decision should also consider the interpretability and meaningfulness of the clusters in the context of the problem.
Implementing Hierarchical Clustering in Python
Python provides the scipy library, which offers an easy-to-use implementation of hierarchical clustering. Here‘s an example of how to perform agglomerative hierarchical clustering using scipy:
from scipy.cluster.hierarchy import dendrogram, linkage
from matplotlib import pyplot as plt

# Generate sample data
X = [[1, 2], [1.5, 1.8], [5, 8], [8, 8], [1, 0.6], [9, 11]]

# Calculate the linkage matrix
Z = linkage(X, method=‘ward‘)

# Plot the dendrogram
dendrogram(Z)
plt.show()
In this example, we generate a sample dataset X and calculate the linkage matrix using the Ward‘s method. The dendrogram function is then used to plot the dendrogram.
To obtain the cluster labels for a specific number of clusters, you can use the fcluster function from scipy:
from scipy.cluster.hierarchy import fcluster

# Obtain cluster labels for 3 clusters
labels = fcluster(Z, 3, criterion=‘maxclust‘)
print(labels)
This will assign each data point to one of the three clusters based on the hierarchical structure.
Example Use Case: Customer Segmentation
Let‘s consider a real-world example of using hierarchical clustering for customer segmentation. We‘ll use the "Mall Customer Segmentation Data" dataset, which contains information about customers of a mall, including their age, annual income, and spending score.
import pandas as pd
from scipy.cluster.hierarchy import dendrogram, linkage, fcluster
from matplotlib import pyplot as plt

# Load the dataset
data = pd.read_csv(‘Mall_Customers.csv‘)

# Select relevant features
X = data[[‘Annual Income (k$)‘, ‘Spending Score (1-100)‘]].values

# Perform hierarchical clustering
Z = linkage(X, method=‘ward‘)

# Plot the dendrogram
dendrogram(Z)
plt.show()

# Obtain cluster labels for 5 clusters
labels = fcluster(Z, 5, criterion=‘maxclust‘)

# Add cluster labels to the dataset
data[‘Cluster‘] = labels

# Visualize the clusters
plt.figure(figsize=(8, 6))
for i in range(1, 6):
    plt.scatter(data[data[‘Cluster‘] == i][‘Annual Income (k$)‘],
                data[data[‘Cluster‘] == i][‘Spending Score (1-100)‘],
                label=f‘Cluster {i}‘)
plt.xlabel(‘Annual Income (k$)‘)
plt.ylabel(‘Spending Score (1-100)‘)
plt.legend()
plt.show()
In this example, we load the dataset, select the relevant features (annual income and spending score), and perform hierarchical clustering using the Ward‘s method. After plotting the dendrogram, we obtain cluster labels for 5 clusters and visualize the clusters using a scatter plot.
Comparing Hierarchical Clustering to K-means
Hierarchical clustering and k-means are two popular clustering algorithms, each with its own strengths and weaknesses. Here are some key differences:
- Number of clusters: K-means requires specifying the number of clusters in advance, while hierarchical clustering does not. However, you still need to choose the number of clusters when cutting the dendrogram.
- Flexibility: Hierarchical clustering can produce clusters of arbitrary shapes and sizes, while k-means tends to produce spherical clusters of similar sizes.
- Computational complexity: Hierarchical clustering has a higher computational complexity (O(n^3)) compared to k-means (O(nki)), where n is the number of data points, k is the number of clusters, and i is the number of iterations.
- Sensitivity to initialization: K-means is sensitive to the initial placement of centroids, which can lead to different results across multiple runs. Hierarchical clustering is deterministic and always produces the same result for a given dataset and linkage method.
Pros and Cons of Hierarchical Clustering
Pros:
- Does not require specifying the number of clusters in advance
- Can produce clusters of arbitrary shapes and sizes
- Provides a visual representation of the clustering process through dendrograms
- Deterministic results for a given dataset and linkage method
Cons:
- Higher computational complexity compared to k-means
- Sensitive to the choice of distance metric and linkage method
- Once a merge or split is done, it cannot be undone, which may lead to suboptimal clusters
- Dendrograms can become difficult to interpret for large datasets
Advanced Topics and Extensions
Hierarchical clustering can be extended and modified to handle various scenarios:
- Clustering with constraints: Incorporating prior knowledge or constraints into the clustering process, such as must-link and cannot-link constraints between data points.
- Mini-batch hierarchical clustering: An approximation technique that processes data in small batches to handle large datasets more efficiently.
- Consensus clustering: Combining multiple clustering results to obtain a more robust and stable clustering solution.
- Hierarchical density-based clustering: Combining hierarchical clustering with density-based clustering techniques like DBSCAN to handle datasets with varying densities.
Frequently Asked Questions
-
Q: When should I use hierarchical clustering instead of k-means?
A: Hierarchical clustering is preferred when you don‘t know the number of clusters in advance, want to explore the hierarchical structure of the data, or have clusters of arbitrary shapes and sizes. K-means is more suitable when you have a large dataset, know the desired number of clusters, and expect spherical clusters of similar sizes. -
Q: How do I choose the appropriate distance metric and linkage method?
A: The choice depends on the nature of your data and the desired clustering properties. Euclidean distance is commonly used for continuous data, while cosine similarity is often used for text or high-dimensional data. Ward‘s method tends to produce compact and spherical clusters, while single linkage can handle non-convex shapes but is sensitive to noise. -
Q: Can hierarchical clustering handle categorical or mixed data types?
A: Yes, hierarchical clustering can handle categorical or mixed data types by using appropriate distance metrics such as the Gower distance or the Jaccard similarity coefficient. -
Q: How can I assess the quality of the clustering results?
A: You can use internal evaluation metrics like the silhouette coefficient or the Calinski-Harabasz index to assess the compactness and separation of clusters. External evaluation metrics like the adjusted Rand index or the normalized mutual information can be used if you have ground truth labels available.
Conclusion
Hierarchical clustering is a versatile and powerful technique for exploring and understanding the structure of your data. By creating a hierarchy of clusters, it provides insights into the relationships between data points at different levels of granularity. With its ability to handle arbitrary cluster shapes and sizes, hierarchical clustering is particularly useful when you don‘t have prior knowledge about the number of clusters or when you want to visualize the clustering process through dendrograms.
In this beginner‘s guide, we covered the fundamentals of hierarchical clustering, including the agglomerative approach, linkage methods, distance metrics, and dendrogram interpretation. We also demonstrated how to implement hierarchical clustering in Python using the scipy library and visualize the results using matplotlib.
As you dive deeper into hierarchical clustering, you can explore advanced topics like clustering with constraints, mini-batch hierarchical clustering, consensus clustering, and hierarchical density-based clustering. These extensions enhance the capabilities of hierarchical clustering and allow you to tackle more complex and large-scale clustering problems.
Remember, the choice between hierarchical clustering and other clustering algorithms like k-means depends on your specific problem and data characteristics. It‘s important to experiment with different techniques, evaluate the clustering results, and consider the interpretability and meaningfulness of the clusters in the context of your domain.
With this foundation in hierarchical clustering, you are now equipped to apply this technique to your own datasets and uncover hidden patterns and structures. Happy clustering!